Answered step by step
Verified Expert Solution
Question
1 Approved Answer
Electromagnetism (2) Smith Chart Matching One technique to achieve matching in transmission lines is to connect a piece of transmission line (either short circuited or

Electromagnetism (2)
Smith Chart Matching
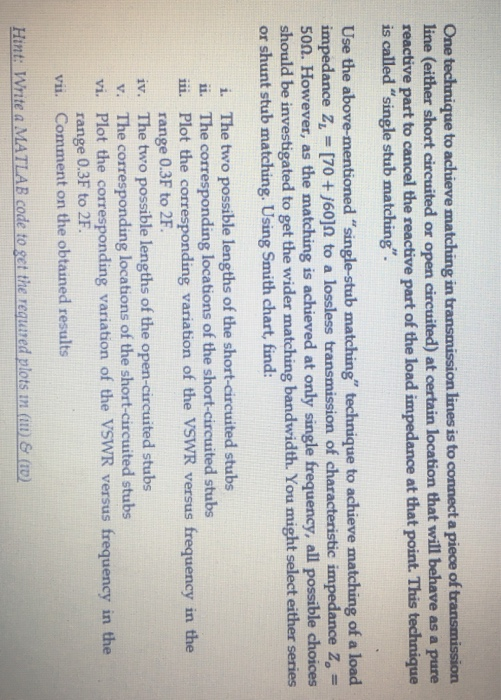
One technique to achieve matching in transmission lines is to connect a piece of transmission line (either short circuited or open circuited) at certain location that will behave as a pure reactive part to cancel the reactive part of the load impedance at that point. This technique is called "single stub matching". Use the above-mentioned "single-stub matching technique to achieve matching of a load impedance z = [70 + 360] to a lossless transmission of characteristic impedance z. 500. However, as the matching is achieved at only single frequency, all possible choices should be investigated to get the wider matching bandwidth. You might select either series or shunt stub matching. Using Smith chart, find: i. The two possible lengths of the short-circuited stubs i. The corresponding locations of the short-circuited stubs iii. Plot the corresponding variation of the VSWR versus frequency in the range 0.3F to 2F iv. The two possible lengths of the open-circuited stubs v. The corresponding locations of the short-circuited stubs vi. Plot the corresponding variation of the VSWR versus frequency in the range 0.3F to 2F vii. Comment on the obtained results Hint: Write a MATLAB code to get the required plots in (II) & (10) One technique to achieve matching in transmission lines is to connect a piece of transmission line (either short circuited or open circuited) at certain location that will behave as a pure reactive part to cancel the reactive part of the load impedance at that point. This technique is called "single stub matching". Use the above-mentioned "single-stub matching technique to achieve matching of a load impedance z = [70 + 360] to a lossless transmission of characteristic impedance z. 500. However, as the matching is achieved at only single frequency, all possible choices should be investigated to get the wider matching bandwidth. You might select either series or shunt stub matching. Using Smith chart, find: i. The two possible lengths of the short-circuited stubs i. The corresponding locations of the short-circuited stubs iii. Plot the corresponding variation of the VSWR versus frequency in the range 0.3F to 2F iv. The two possible lengths of the open-circuited stubs v. The corresponding locations of the short-circuited stubs vi. Plot the corresponding variation of the VSWR versus frequency in the range 0.3F to 2F vii. Comment on the obtained results Hint: Write a MATLAB code to get the required plots in (II) & Step by Step Solution
There are 3 Steps involved in it
Step: 1

Get Instant Access to Expert-Tailored Solutions
See step-by-step solutions with expert insights and AI powered tools for academic success
Step: 2

Step: 3

Ace Your Homework with AI
Get the answers you need in no time with our AI-driven, step-by-step assistance
Get Started


