Question
Eli Orchid has designed a new pharmaceutical product, Orchid Relief, which improves the night sleep. Before initiating mass production of the product, Eli Orchid has
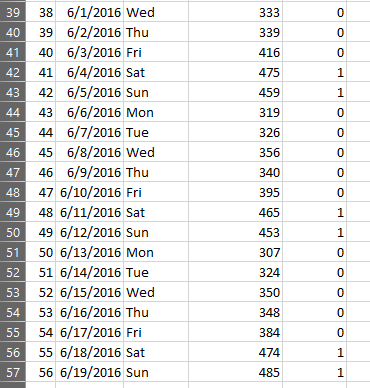
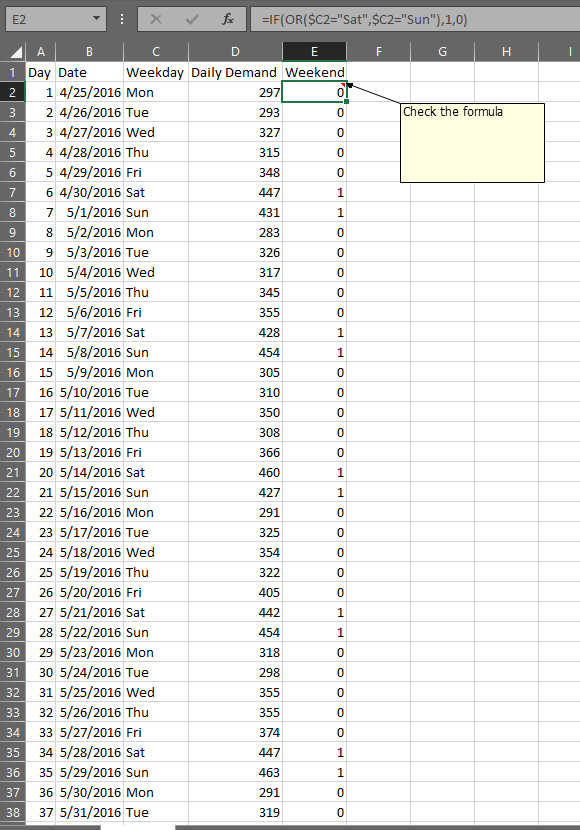
Eli Orchid has designed a new pharmaceutical product, Orchid Relief, which improves the night sleep. Before initiating mass production of the product, Eli Orchid has been market-testing Orchid Relief in Orange County over the past 8 weeks. The daily demand values are recorded in the Excel file provided. Eli Orchid plans on using the sales data to predict sales for the upcoming week. An accurate forecast would be helpful in making arrangements for the company's production processes and designing promotions.
Before a forecasting model is built and a forecast for the next week is generated, the COO of the company has asked the data analyst for an exploratory analysis of the demand.
Specifically, the COO has asked the analyst[1]:
1. To provide a bar chart (with data labels rounded to two decimal points) showing the average demand for each week day (Sun., Mon., etc.)
[add chart here]
2. To fit a simple linear regression model to the data and to provide its equation (d = a*t + b), along with R2
d =
R2=
3. To fit a multiple regression model with a dummy variable representing the weekend, and to provide the regression equation (d = a*t + b*w + c), along with R2.
d =
Adjusted R2=
4. To provide a run-series plot of the actual demand with simple regression and multiple regression overlay.
[add chart here]
5. To write a short paragraph explaining the observations and providing general recommendations for the next seven days demand forecast.
[write your paragraph here]
6. To fit a new multiple regression model with dummy variables for seven days in a week (Mon, Tue, ..., Sun), and to provide the regression equation (d = a*t + b1x1 + b2x2 + b3x3 + b4x4 + b5x5 + b6x6 + c), along with R2.
d =
R2=
7. To use all three models:
M1: d = 1.0356t + 339.29
M2: d=0.7163t+116.7679w+315.0262
M3: (the one considering weekdays)
to predict the demand for seven days ahead (Mon, Tue, ..., Sun) and find the total weekly demand.
M1
M2
M3
Mon.
Tue.
Wed.
Thu.
Fri.
Sat.
Sun.
TOTAL:
8. Take advantage of the fact that new demand data became available and use this new data to compare the forecasts using MAPE for days 57-63.
New: M: 311 T: 341 W: 357 Th: 363 F: 390 Sa: 490 Su: 492
MAPEM1:
MAPEM2:
MAPEM3:
9. To provide a line chart with the actual demand (including the new data) and M2 and M3.
10. To choose the best model for forecasting daily demand at Orchid Relief for 7 days ahead and write a short paragraph explaining your choice.
[write your paragraph here]
[1] Round numbers to four decimal points (e.g. 0.1234), unless explicitly requested otherwise.
Excel Data Info Shown below:


Step by Step Solution
There are 3 Steps involved in it
Step: 1

Get Instant Access to Expert-Tailored Solutions
See step-by-step solutions with expert insights and AI powered tools for academic success
Step: 2

Step: 3

Ace Your Homework with AI
Get the answers you need in no time with our AI-driven, step-by-step assistance
Get Started


