

Answered step by step
Verified Expert Solution
Question
1 Approved Answer
Environmental Cost Report begin{tabular}{lr} & multicolumn{1}{c}{205} hline Settling personal injury claims & $3,000,000 Treating and disposing of toxic waste & 12,000,000 Cleanup
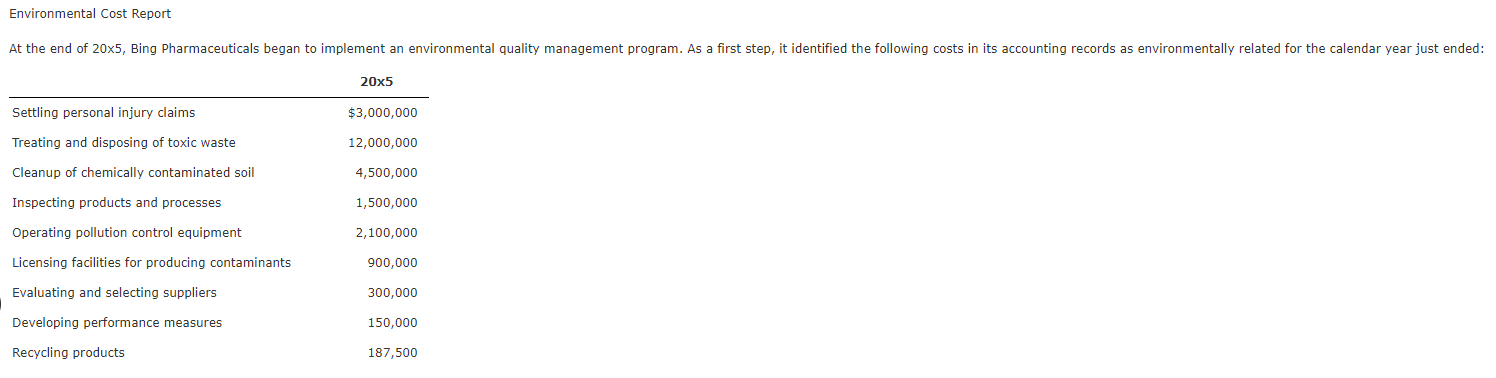
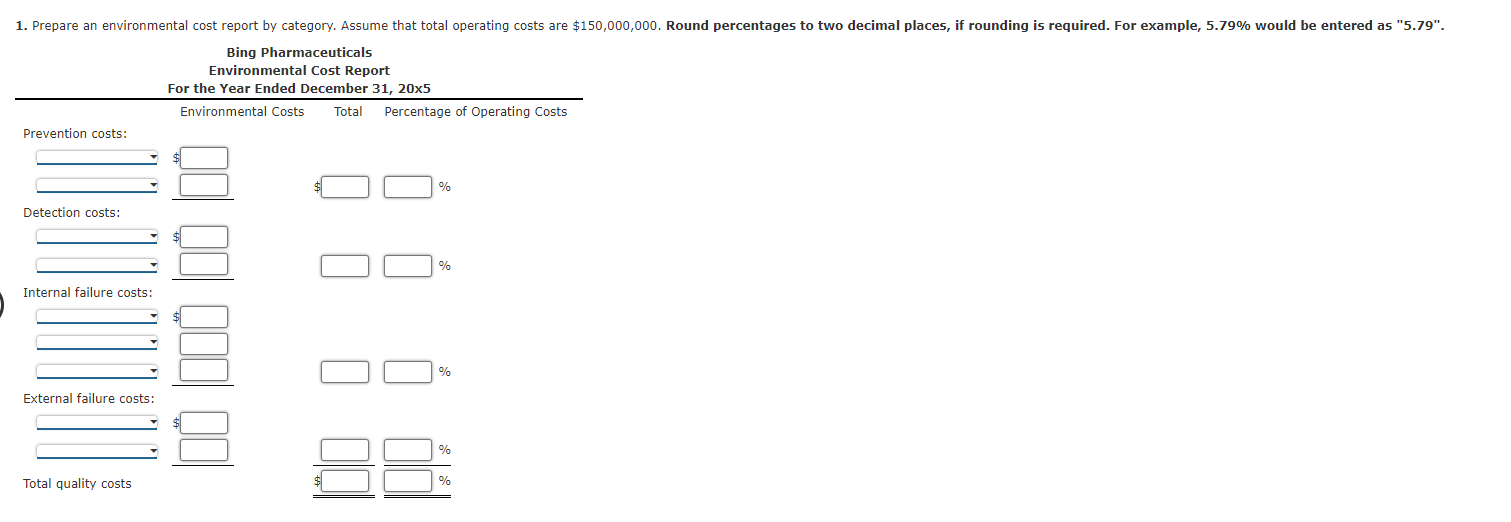
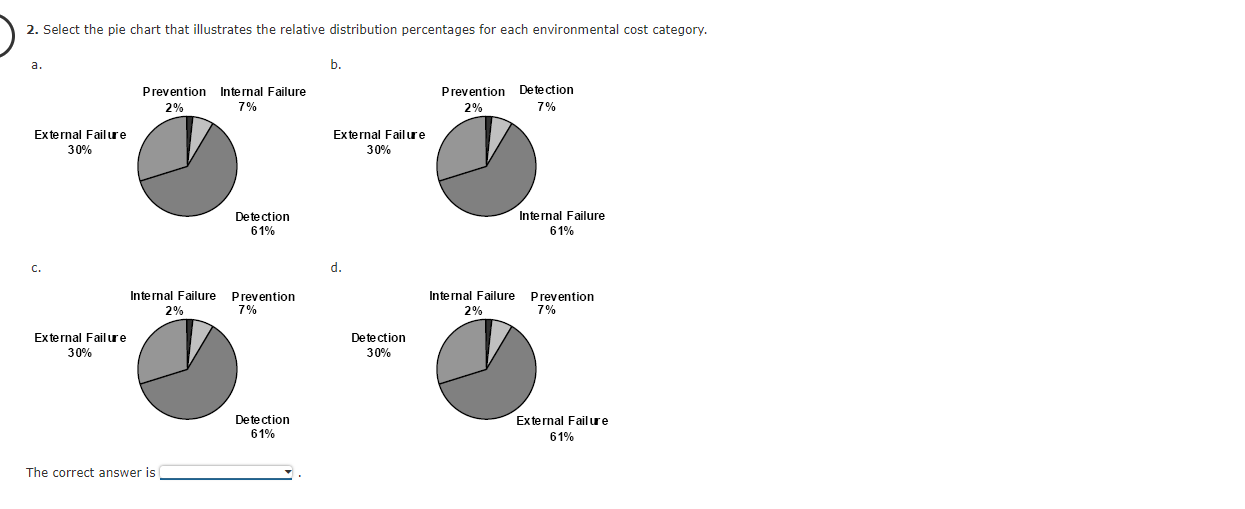 Environmental Cost Report \begin{tabular}{lr} & \multicolumn{1}{c}{205} \\ \hline Settling personal injury claims & $3,000,000 \\ Treating and disposing of toxic waste & 12,000,000 \\ Cleanup of chemically contaminated soil & 4,500,000 \\ Inspecting products and processes & 1,500,000 \\ Operating pollution control equipment & 2,100,000 \\ Licensing facilities for producing contaminants & 900,000 \\ Evaluating and selecting suppliers & 300,000 \\ Developing performance measures & 150,000 \\ Recycling products & 187,500 \end{tabular} Bing Pharmaceuticals Environmental Cost Report For the Year Ended December 31, 20x5 2. Select the pie chart that illustrates the relative distribution percentages for each environmental cost category. a. b. c. Detection 30% The correct answer is
 Step by Step Solution
There are 3 Steps involved in it
Step: 1

Get Instant Access to Expert-Tailored Solutions
See step-by-step solutions with expert insights and AI powered tools for academic success
Step: 2

Step: 3
Ace Your Homework with AI
Get the answers you need in no time with our AI-driven, step-by-step assistance
Get Started
Accounting For Managers Financial Accounting
Authors: Morusu Sivasankar
1st Edition
6200624909, 978-6200624901