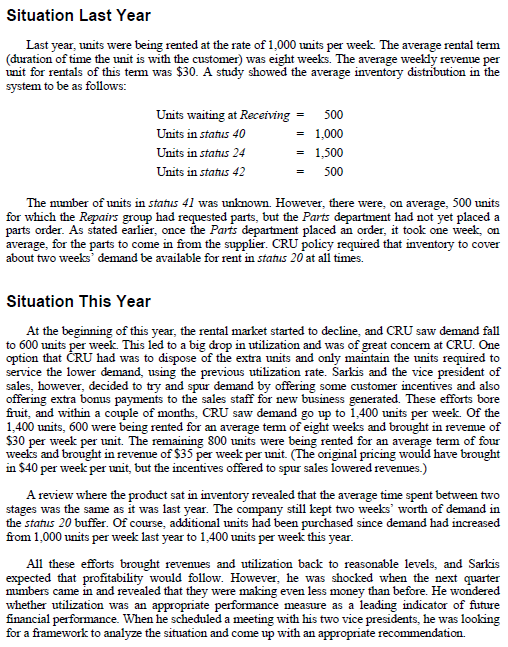
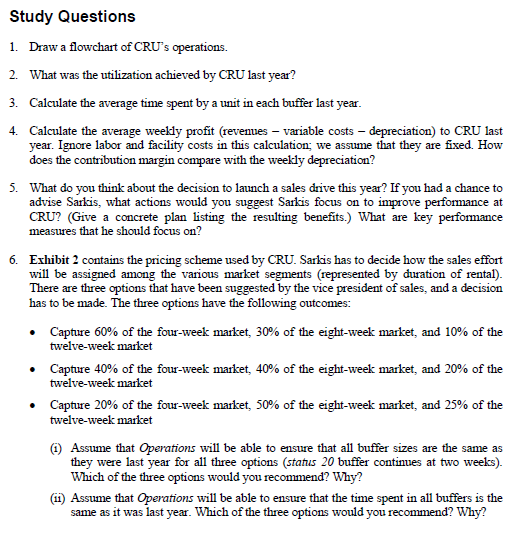
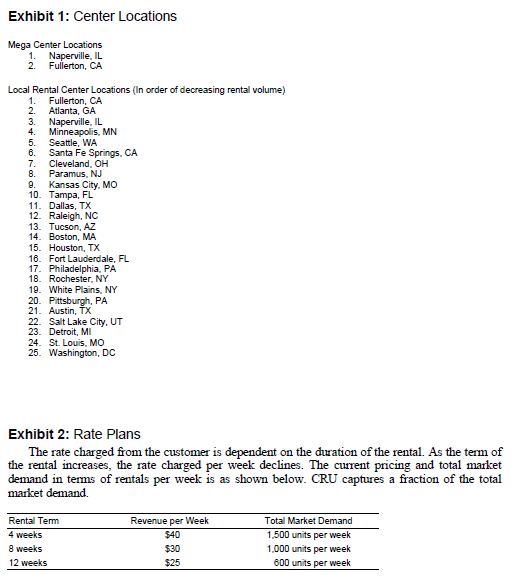
equivalent of the weekly depreciation on new machines to keep its inventory of computers relatively fresh. CRU Operations and the Rental Cycle CRU currently had two main warehouses (or "Mega Centers") located in Naperville, Illinois, and Fullerton, Califomia, and 23 local retail centers (LRCs) located throughout the country. Exhibit 1 shows the Mega Center and LRC locations. All equipment that was available to rent was stocked at one of these locations with more than 90 percent of the equipment held at the Mega Centers. When returned from the customers, all equipment was sent to the Mega Centers for repair and reconfiguration. The flow of orders and units through the CRU system was as follows. A customer called a toll-free number or a local CRU rental number. Calls were automatically routed to a sales specialist at either a nearby LRC or to one of the two Mega Centers. The sales specialist identified the customer (existing or new), verified credit, and took the order. The sales specialist had access to the Available for Rent inventory in each warehouse, by item code, on a screen in front of her. She assigned a particular unit in a warehouse to be shipped to the customer. Once an order was taken, the unit was removed from the Available for Rent inventory (status 20) and put on a Reserve status (statis 32). Sales specialists were trained to search for substitutes in case a specific piece of equipment was not available. They recommended these substitutes to customers, working with the customer to find something suitable. Once an order was entered into the system, it was routed to Quality Assurance and Picking where the order printed out automatically from a printer linked to the order-taking system. The printed document contained the details of the order as well as the shipping date. It sometimes also contained specific instructions with regard to the order. After reviewing the order for accuracy and the delivery date, the picker located the specific item(s) in the warehouse, picked it (them), and delivered it (them) to a holding area in the Configuration section. Technicians picked up orders for configuration along with the order forms from this holding area. The technicians were required to pick orders in sequence. There was, however, a tendency to pick orders that were perceived to be easy. Machines in the warehouse were stored in a standard configuration in terms of hardware and software. However, most orders required some variation in terms of memory, hard-drive size, other hardware, or even software. The technician in the Configuration section configured the equipment as per customer request by cleaning the equipment, installing any necessary hardware (e.g., memory chips, print cartridges, etc.), and loading appropriate software. All technicians were capable of installing all types of hardware and software. Once all items comprising an order were configured, the technician rolled the cart containing the configured order to the Shipping department. A shipper then reviewed the invoice tag to verify contents, ship date, and ship mode. The items were then packaged, labeled, and shipped out by the appropriate mode. The shipping cost (bome by CRU) averaged $25 per unit. Once the customer completed the rental term, (s)he packaged the units and shipped them back, using pre-addressed labels, to one of the Mega Centers. The retum shipping cost (incurred by CRU) also averaged $25 per unit. Sometimes the units were returned by the customers prior to the end of the rental term because they were "broken" or need repairs. All returned units were received at a Mega Center in the Receiving department. Upon arrival, each unit was classified as defective (status 40 ) or not defective (status 24 ). Status 24 units were put into storage to be worked on by the Pre-Configuration department, and status 40 units were put into storage to be worked on by the Repairs group. Historically, 30 percent of the units received had been classified as status 40 and 70 percent of the units received had been classified as status 24 at Receiving. When a technician in the Pre-Configuration department was ready to work on a unit, it was picked from storage and brought to the technician. The technician did a quick check to see that it was not defective. Historically, 15 percent of the status 24 units had turned out to be defective. In other words, they should have been classified as status 40 at Receiving but were not classified correctly. In this case, the technician changed the status of the unit to status 40 and returned it to storage. If the unit worked, the technician then removed any stickers that might have been specific to the previous customer, reformatted the hard drive, did some basic cleaning, and put the unit back into storage as Available for Rent, or status 20 . The average material cost to convert a unit from status 24 to status 20 was $4. When a technician in the Repairs group was ready to work on a unit, it was picked from storage and brought to the technician. The technician then ran a series of tests to identify any parts that might need to be replaced. An order sheet was completed and sent to the Parts department. The unit was now classified as status 41 . The Repairs technician then sent the status 41 unit into storage. The order sheets themselves queued up at the Parts department. The Parts department used information from the order sheets to place orders with the suppliers. Once an order was placed with the parts supplier, it took an average of one week before the part arrived to the Parts department. When the parts came in, they were received by the Parts group and taped on top of the machines for later installation. The unit was now classified as status 42. Repair technicians pulled status 42 units from storage, repaired them, and converted them to status 20 units, making them Available for Rent. The average parts cost when repairing a defective unit was $150 per unit. This did not include any labor costs. Performance Measures The key performance measure tracked at CRU had been "utilization." It was defined as Utilization = Number of Units on Rent Number of Units Owned by CRU. Utilization is primarily an inventory-related measure and can be restated as Utilization = Inventory on Rent Total Inventory Owned by CRU. For the last several years, Sarkis had managed the business by trying to ensure that utilization at CRU never dropped below 50 percent. The idea behind this is that if most of the units owned by CRU were with customers, they were generating revenue. On entering the office of CRU in Naperville, one first encountered a monitor displaying current utilization figures and historical trends during the last 12 weeks. Each unit in the CRU inventory had an average purchase price of $1,000, and CRU had followed a straight-line depreciation over 36 months. Situation Last Year Last year, units were being rented at the rate of 1,000 units per week. The average rental term (duration of time the unit is with the customer) was eight weeks. The average weekly revenue per unit for rentals of this term was $30. A study showed the average inventory distribution in the system to be as follows: The number of units in status 41 was unknown. However, there were, on average, 500 units for which the Repairs group had requested parts, but the Parts department had not yet placed a parts order. As stated earlier, once the Parts department placed an order, it took one week, on average, for the parts to come in from the supplier. CRU policy required that inventory to cover about two weeks' demand be available for rent in status 20 at all times. Situation This Year At the beginning of this year, the rental market started to decline, and CRU saw demand fall to 600 units per week. This led to a big drop in utilization and was of great concern at CRU. One option that CRU had was to dispose of the extra units and only maintain the units required to service the lower demand, using the previous utilization rate. Sarkis and the vice president of sales, however, decided to try and spur demand by offering some customer incentives and also offering extra bonus payments to the sales staff for new business generated. These efforts bore fruit, and within a couple of months, CRU saw demand go up to 1,400 units per week. Of the 1,400 units, 600 were being rented for an average term of eight weeks and brought in revemue of $30 per week per unit. The remaining 800 units were being rented for an average term of four weeks and brought in revenue of $35 per week per unit. (The original pricing would have brought in $40 per week per unit, but the incentives offered to spur sales lowered revenues.) A review where the product sat in inventory revealed that the average time spent between two stages was the same as it was last year. The company still kept two weeks' worth of demand in the status 20 buffer. Of course, additional units had been purchased since demand had increased from 1,000 units per week last year to 1,400 units per week this year. All these efforts brought revenues and utilization back to reasonable levels, and Sarkis expected that profitability would follow. However, he was shocked when the next quarter numbers came in and revealed that they were making even less money than before. He wondered whether utilization was an appropriate performance measure as a leading indicator of future financial performance. When he scheduled a meeting with his two vice presidents, he was loolking for a framework to analyze the situation and come up with an appropriate recommendation. Study Questions 1. Draw a flowchart of CRU's operations. 2. What was the utilization achieved by CRU last year? 3. Calculate the average time spent by a unit in each buffer last year. 4. Calculate the average weekly profit (revenues - variable costs - depreciation) to CRU last year. Ignore labor and facility costs in this calculation; we assume that they are fixed. How does the contribution margin compare with the weekly depreciation? 5. What do you think about the decision to launch a sales drive this year? If you had a chance to advise Sarkis, what actions would you suggest Sarkis focus on to improve performance at CRU? (Give a concrete plan listing the resulting benefits.) What are key performance measures that he should focus on? 6. Exhibit 2 contains the pricing scheme used by CRU. Sarkis has to decide how the sales effort will be assigned among the various market segments (represented by duration of rental). There are three options that have been suggested by the vice president of sales, and a decision has to be made. The three options have the following outcomes: - Capture 60% of the four-week market, 30% of the eight-week market, and 10% of the twelve-week market - Capture 40% of the four-week market, 40% of the eight-week market, and 20% of the twelve-week market - Capture 20\% of the four-week market, 50% of the eight-week market, and 25% of the twelve-week market (i) Assume that Operations will be able to ensure that all buffer sizes are the same as they were last year for all three options (status 20 buffer continues at two weeks). Which of the three options would you recommend? Why? (ii) Assume that Operations will be able to ensure that the time spent in all buffers is the same as it was last year. Which of the three options would you recommend? Why? Exhibit 1: Center Locations Mega Center Locations 1. Naperville, IL 2. Fullerton, CA Local Rental Center Locations (In order of decreasing rental volume) 1. Fullerton, CA 2. Atlanta, GA 3. Naperville, IL 4. Minneapolis, MN 5. Seattle, WA 6. Santa Fe Springs, CA 7. Cleveland, OH 8. Paramus, NJ 9. Kansas City, MO 10. Tampa, FL 11. Dallas, TX 12. Raleigh, NC 13. Tucson, AZ 14. Boston, MA 15. Houston, TX 16. Fort Lauderdale, FL 17. Philadelphia, PA 18. Rochester, NY 19. White Plains, NY 20. Pittsburgh, PA 21. Austin, TX 22. Salt Lake City, UT 23. Detroit, MI 24. St Lovis, MO 25. Washington, DC Exhibit 2: Rate Plans The rate charged from the customer is dependent on the duration of the rental. As the term of the rental increases, the rate charged per week declines. The current pricing and total market demand in terms of rentals per week is as shown below. CRU captures a fraction of the total market demand


