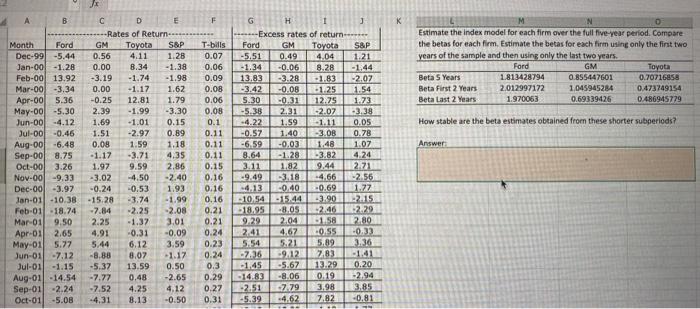
Estimate the index model for each firm over the full five-year period. Compare the betas for each firm. Estimate the betas for each firm using only the first two years of the sample and then using only the last two years.
Ford
Beta 5 Years: 1.813428794
Beta First 2 Years: 2.012997172
Beta Last 2 Years: 1.970063
GM
Beta 5 Years: 0.855447601
Beta First 2 Years: 1.045945284
Beta Last 2 Years: 0.69339426
Toyota
Beta 5 Years: 0.70716858
Beta First 2 Years: 0.473749154
Beta Last 2 Years: 0.486945779
How stable are the beta estimates obtained from these shorter sub periods?
A B K Estimate the index model for each firm over the full five-year period. Compare the betas for each firm. Estimate the betas for each firm using only the first two years of the sample and then using only the last two years. Ford GM Toyota Beta 5 Years 1.813428794 0.855447601 0.70716858 Beta First 2 years 2.012997172 1.045945284 0.473749154 Beta Last 2 years 1.970063 0.69339426 0.486945779 How stable are the beta estimates obtained from these shorter subperiods? 1.48 1.07 Answer Month Ford Dec-99 -5.44 Jan-00 -1.28 Feb-00 13.92 Mar-00 -3.34 Apr-00 5.36 May-00 -5.30 Jun-00 -4.12 Jul-00 -0.46 Aug-00 -6.48 Sep-00 8.75 Oct-00 3.26 Nov-00-9.33 Dec-00-3.97 Jan-01 -10.38 Feb-01 -18.74 Mar-01 9.50 Apr-01 2.65 May-01 5.77 Jun-01 -7.12 Jul-011 -1.15 Aug.01 -14.54 Sep-01 -2.24 Oct-01 -5.08 D E -Rates of Return GM Toyota S&P 0.56 4.11 1.28 0.00 8.34 -1.38 -3.19 -1.74 -1.98 0.00 -1.17 1.62 -0.25 12.81 1.79 2.39 -1.99 -3.30 1.69 -1.01 0.15 1.51 -2.97 0.89 0.08 1.59 1.18 -1.17 -3.71 4,35 1.97 9.59 2.86 -3.02 -4.50 -2.40 -0.24 -0.53 1.93 -15.28 -3.74 -1.99 -7.84 -2.25 2.08 2.25 -1.37 3.01 4.91 -0.31 -0.09 5.44 6.12 3.59 -8.88 8.07 1.17 -5.37 13.59 0.50 -7.77 0.48 -2.65 -7.52 4.25 4.12 -4.31 8.13 -0.50 F G H J Excess rates of return T-bills Ford GM Toyota S&P 0.07 -5.51 0.49 4.04 1.21 0.06 -1.34 -0.06 8.28 -1.44 0.09 13.83 -3.28 -1.83 -2.07 0.08 -3.42 -0.08 -1.25 1.54 0.06 5.30 -0.31 12.75 0.08 -5.38 2.31 -2.07 -3.38 0.1 -4.22 1.59 -1.11 0.05 0.11 -0.57 1.40 -3.08 0.78 0.11 -6.59 -0.03 0.11 8.64 -1.28 -3.82 4.24 0.15 3.11 1.82 9.44 2.21 0.16 9.49 3.18 -4.66 0.16 -4.13 -0.40 -0.69 0.16 -10.54 - 15.44 32.90 2.15 0.21 18.95 80s -2.46 2.29 0.21 9.29 2.04 2.80 0.24 2.41 4.67 -0.55 -0.3) 0.23 5.54 5.21 5.89 2.36 0.24 -2.36 -9.12 7.83 0.3 -1.45 -5.67 13.29 0.20 0.29 -14.83 -8.06 0.19 -2.94 0.27 2.79 3.98 0.31 -5.39 -4.62 7.82 -0.81 1.27 11 3.85 A B K Estimate the index model for each firm over the full five-year period. Compare the betas for each firm. Estimate the betas for each firm using only the first two years of the sample and then using only the last two years. Ford GM Toyota Beta 5 Years 1.813428794 0.855447601 0.70716858 Beta First 2 years 2.012997172 1.045945284 0.473749154 Beta Last 2 years 1.970063 0.69339426 0.486945779 How stable are the beta estimates obtained from these shorter subperiods? 1.48 1.07 Answer Month Ford Dec-99 -5.44 Jan-00 -1.28 Feb-00 13.92 Mar-00 -3.34 Apr-00 5.36 May-00 -5.30 Jun-00 -4.12 Jul-00 -0.46 Aug-00 -6.48 Sep-00 8.75 Oct-00 3.26 Nov-00-9.33 Dec-00-3.97 Jan-01 -10.38 Feb-01 -18.74 Mar-01 9.50 Apr-01 2.65 May-01 5.77 Jun-01 -7.12 Jul-011 -1.15 Aug.01 -14.54 Sep-01 -2.24 Oct-01 -5.08 D E -Rates of Return GM Toyota S&P 0.56 4.11 1.28 0.00 8.34 -1.38 -3.19 -1.74 -1.98 0.00 -1.17 1.62 -0.25 12.81 1.79 2.39 -1.99 -3.30 1.69 -1.01 0.15 1.51 -2.97 0.89 0.08 1.59 1.18 -1.17 -3.71 4,35 1.97 9.59 2.86 -3.02 -4.50 -2.40 -0.24 -0.53 1.93 -15.28 -3.74 -1.99 -7.84 -2.25 2.08 2.25 -1.37 3.01 4.91 -0.31 -0.09 5.44 6.12 3.59 -8.88 8.07 1.17 -5.37 13.59 0.50 -7.77 0.48 -2.65 -7.52 4.25 4.12 -4.31 8.13 -0.50 F G H J Excess rates of return T-bills Ford GM Toyota S&P 0.07 -5.51 0.49 4.04 1.21 0.06 -1.34 -0.06 8.28 -1.44 0.09 13.83 -3.28 -1.83 -2.07 0.08 -3.42 -0.08 -1.25 1.54 0.06 5.30 -0.31 12.75 0.08 -5.38 2.31 -2.07 -3.38 0.1 -4.22 1.59 -1.11 0.05 0.11 -0.57 1.40 -3.08 0.78 0.11 -6.59 -0.03 0.11 8.64 -1.28 -3.82 4.24 0.15 3.11 1.82 9.44 2.21 0.16 9.49 3.18 -4.66 0.16 -4.13 -0.40 -0.69 0.16 -10.54 - 15.44 32.90 2.15 0.21 18.95 80s -2.46 2.29 0.21 9.29 2.04 2.80 0.24 2.41 4.67 -0.55 -0.3) 0.23 5.54 5.21 5.89 2.36 0.24 -2.36 -9.12 7.83 0.3 -1.45 -5.67 13.29 0.20 0.29 -14.83 -8.06 0.19 -2.94 0.27 2.79 3.98 0.31 -5.39 -4.62 7.82 -0.81 1.27 11 3.85


