

Answered step by step
Verified Expert Solution
Question
1 Approved Answer
Estimate the mass of Jupiter from observation of its moon's. physics 217 lab The data is being given no need to measure it 1. You
Estimate the mass of Jupiter from observation of its moon's.
physics 217 lab
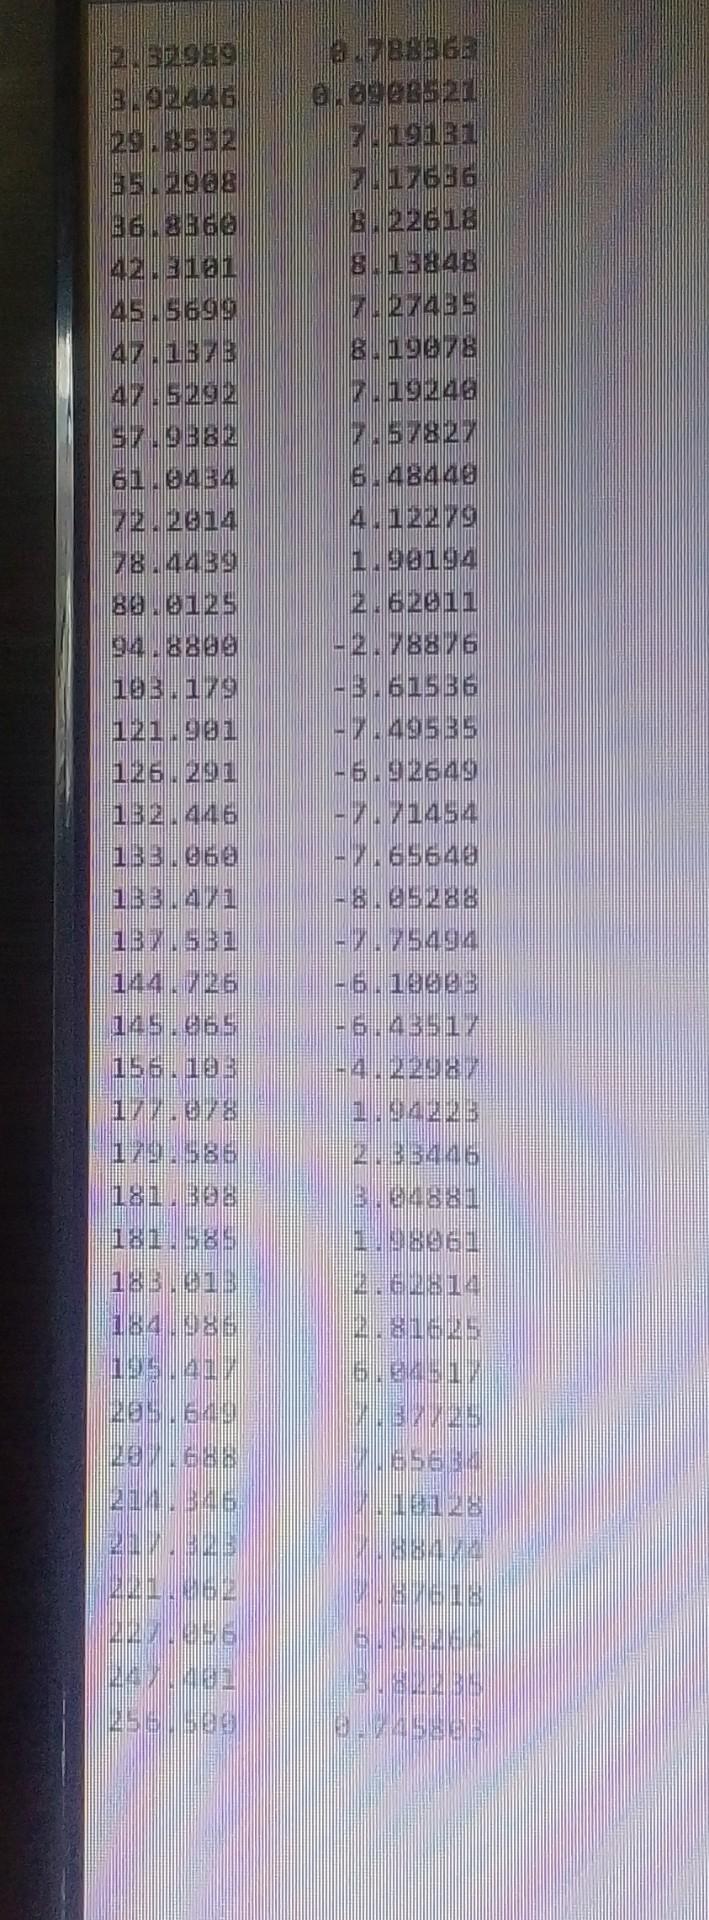
The data is being given no need to measure it
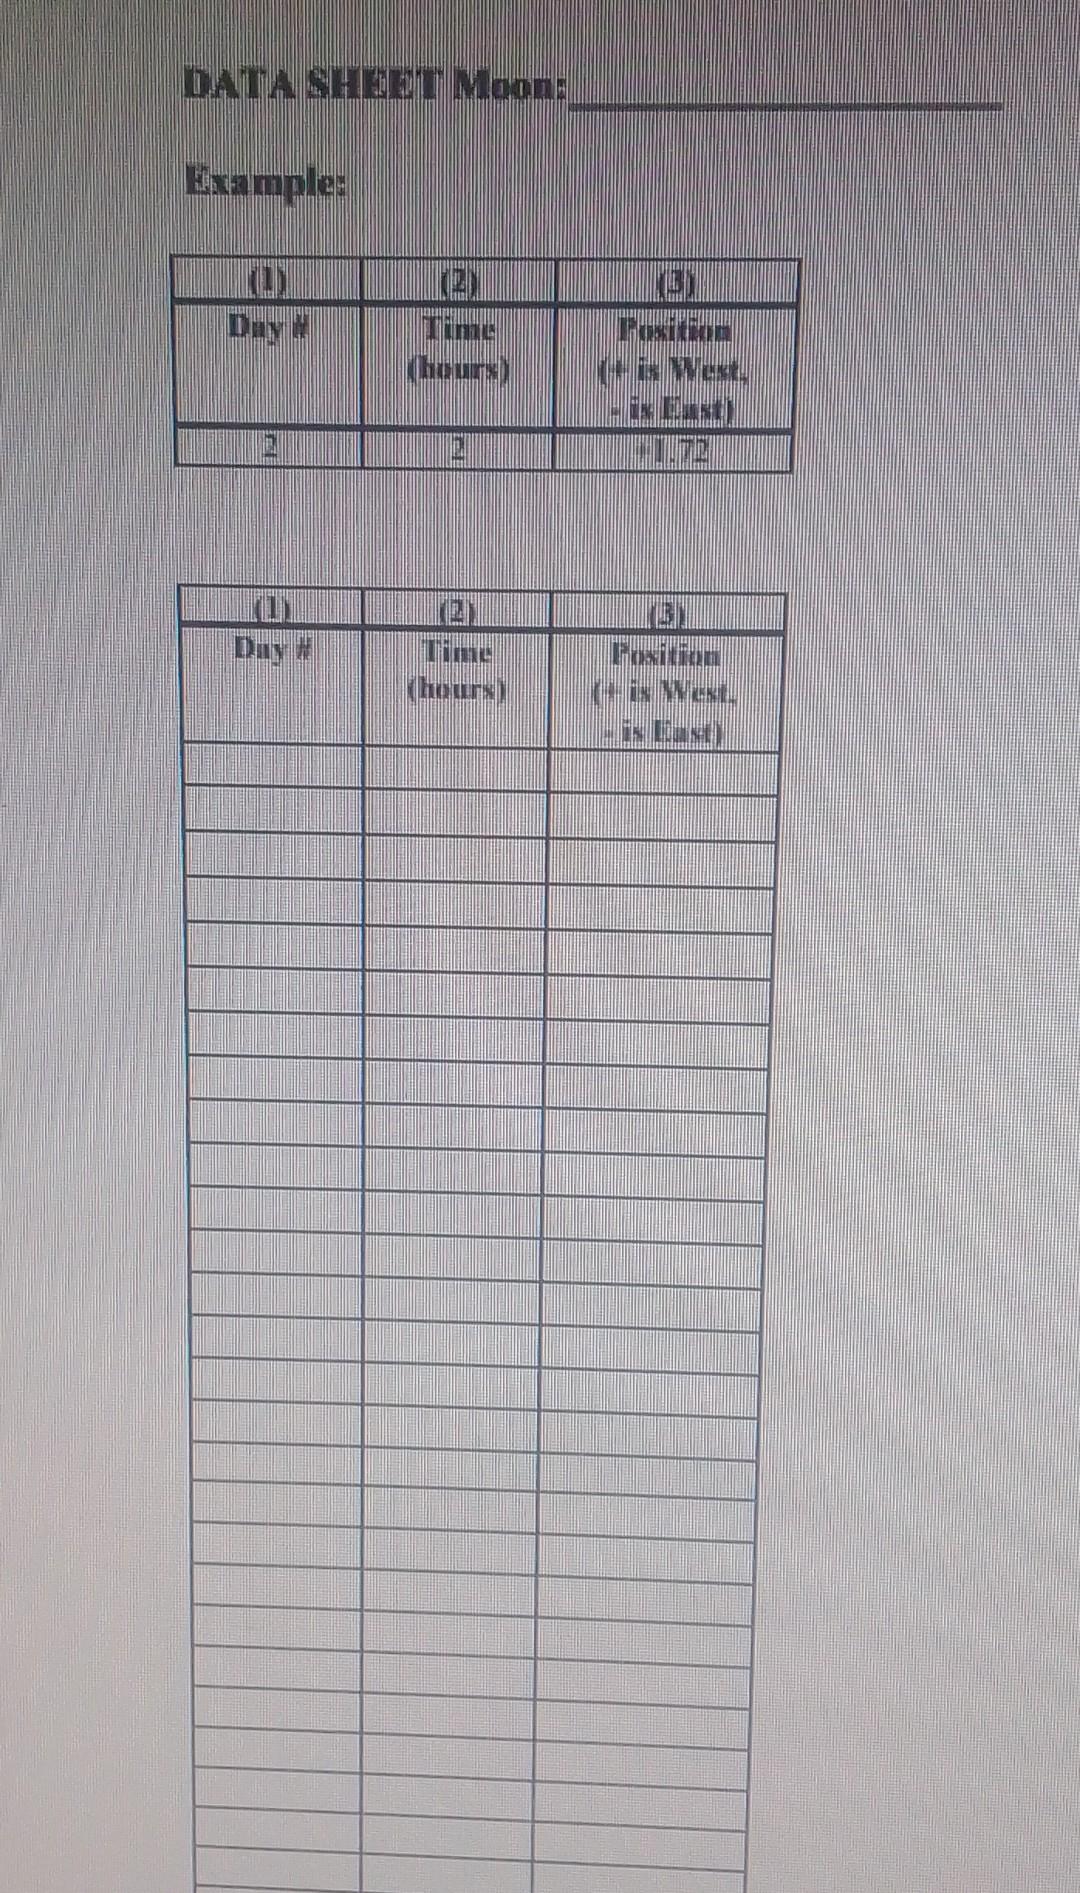
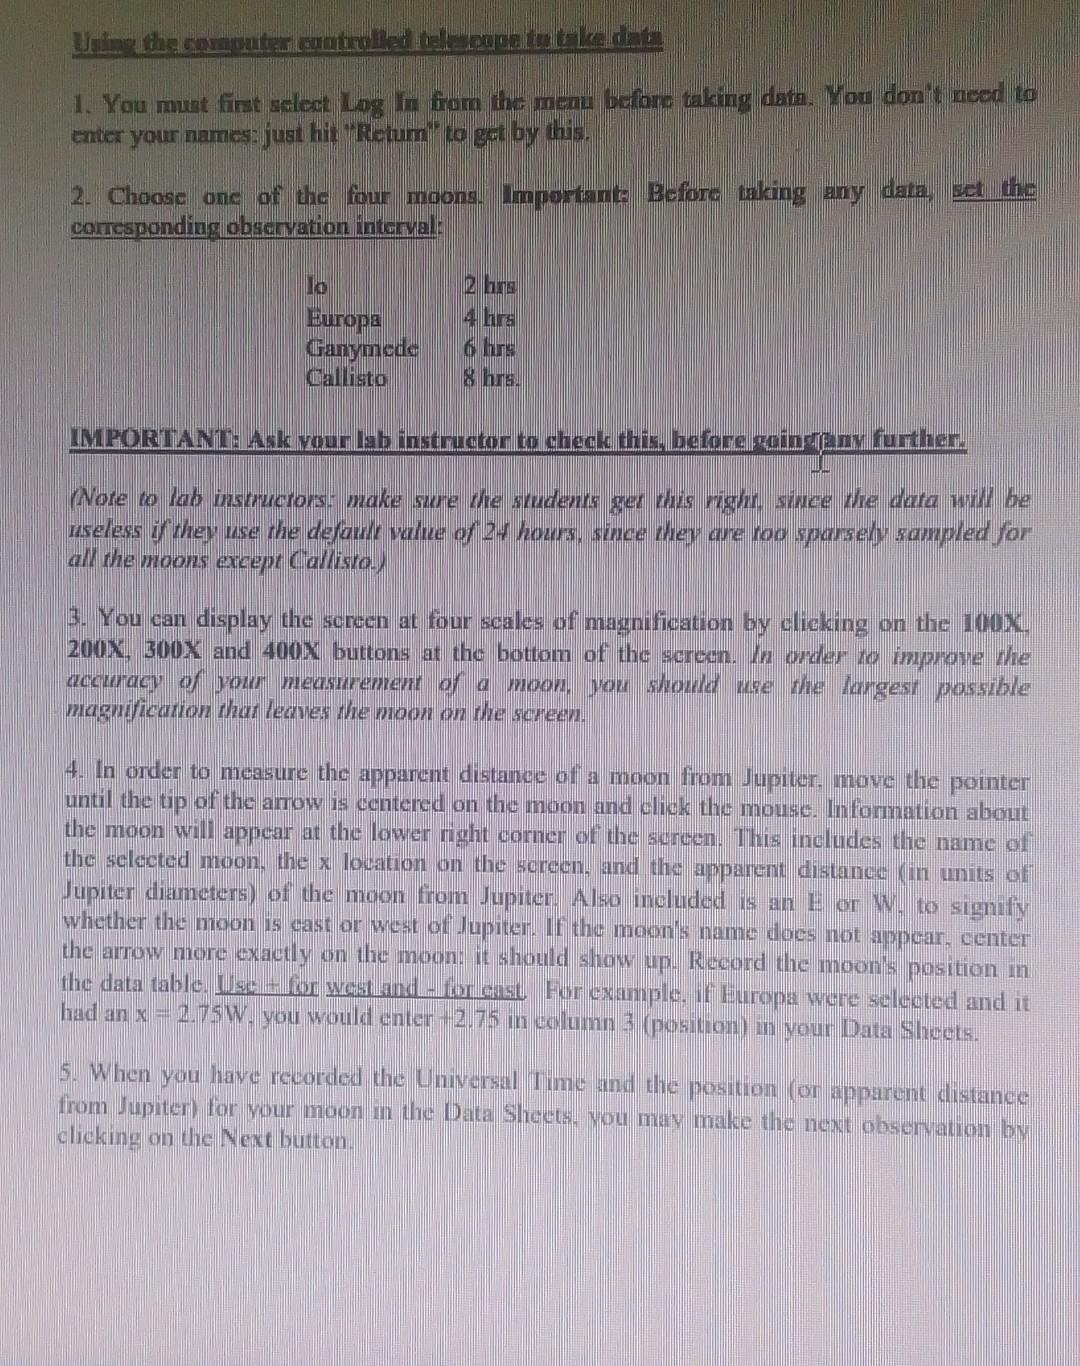
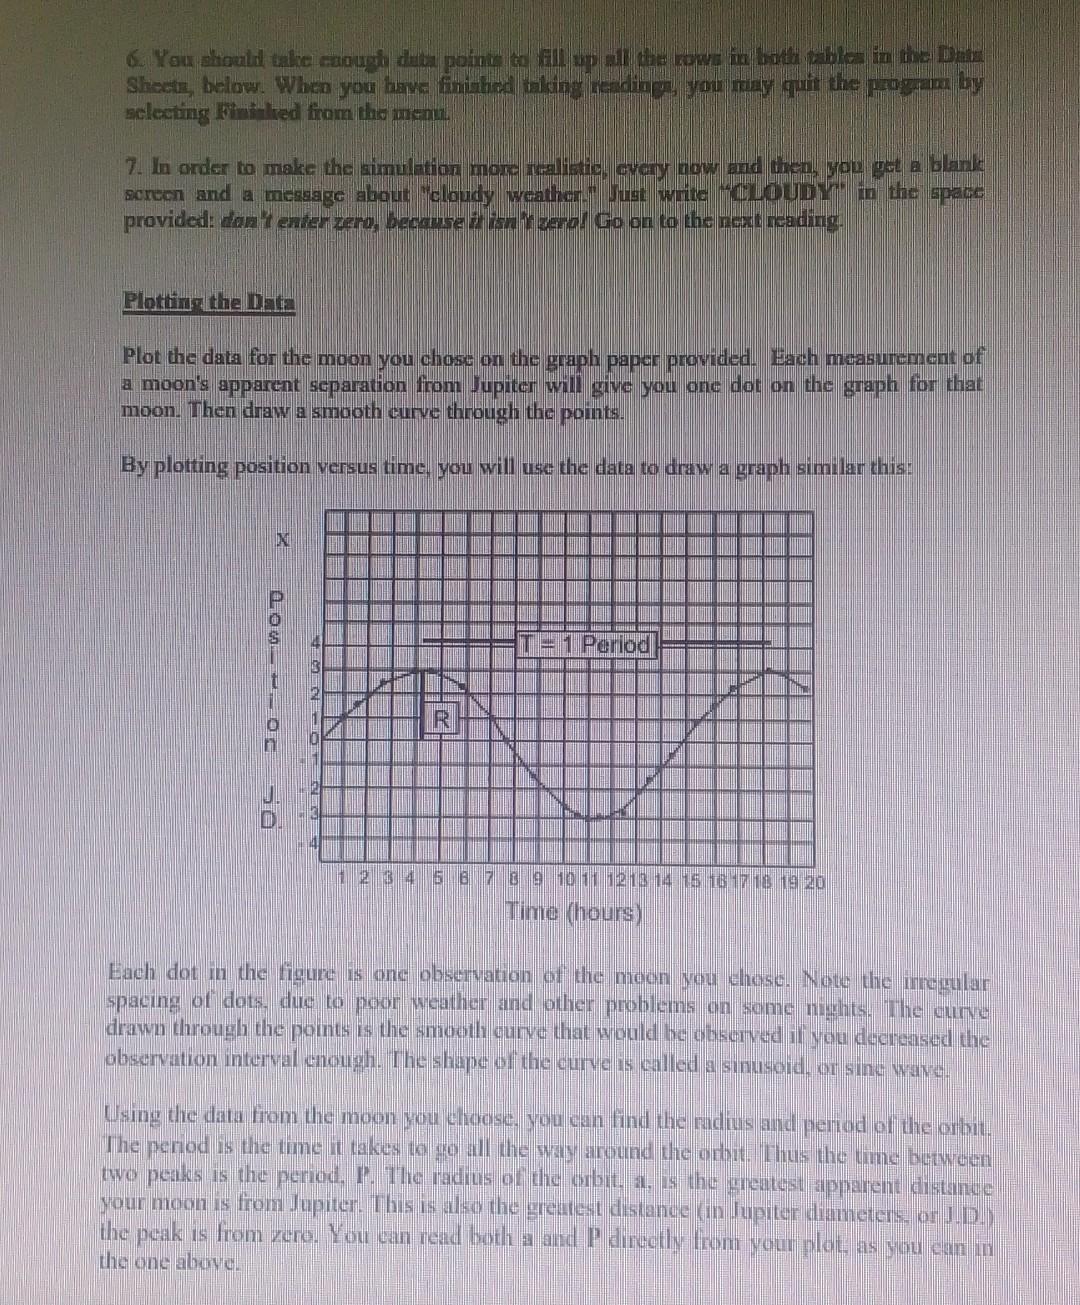
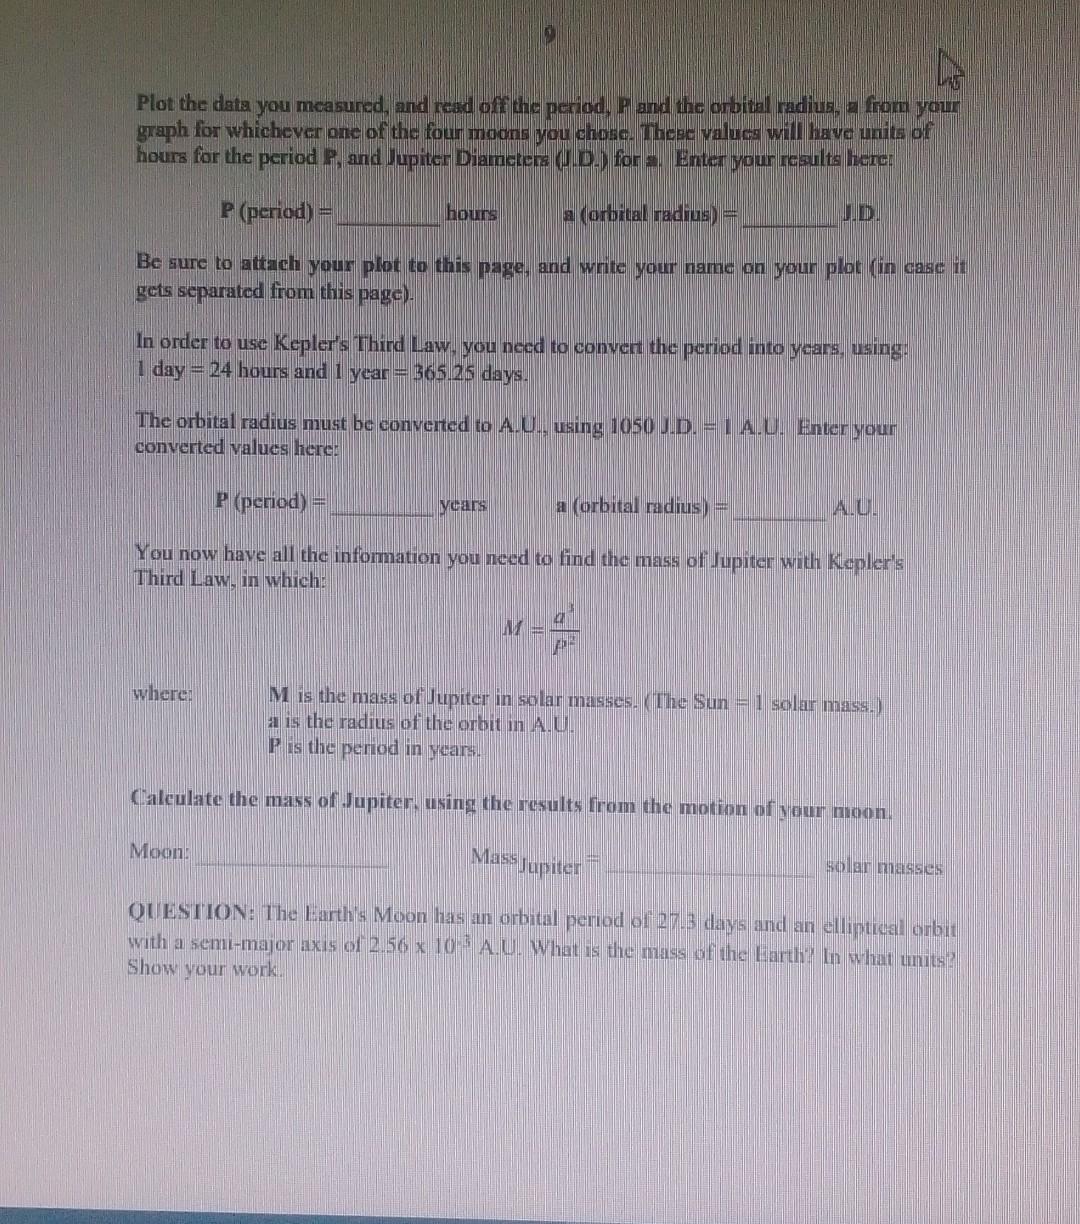
1. You munt fint seloct Lag fi fom the mend Uefore taleing data. You doul need to cuter your names: jugi hi, "iepumi co zet by this. 2. Choose one of the four moons. lmportante Bofore taking any data, eet lhe corresponding observation in terval: (Note to lab insmuctors: make sure the students get this right, since the data will be useless if they nse the defawit value of 2+ hours, since they are roo sparsely sampled for all the moons except (allisro.) 3. You can display the screen at four scales of magnification by clicking on the 1UOX. 200X, 300X and 400X buttons at the bottom of the screen. In order io improve the accuracy of you measurement of a moon, you showld we the langest possible magnification that leaves the moon on the screen. 4. In order to measure the apparent distance of a moon from Jupiter, move the pointer until the tip of the arrow is centered on the moon and cliek the mouse. Information about the moon will appear at the lower right corner of the sereen. This ineludes the name of the selected moon. the x location on the screen, and the apparent distance (in units of Jupiter diameters) of the moon from Jupiter. Also included is an E or Y. to signify whether the moon is east or west of Jupiter. If the moon's name does not appear, center the arrow more exactly on the moon: it should show up. Record the moon's position in the data table. Lese + for west and-for enst. For example, if Huropa were selected and it had an x=2.75W, you would enter 2.75in column 3 (position) in your Data 5 heets. 5. When you have recorded the Universal I ime and the position (or apparent distance from Jupiter) for your moon in the Data Sheets, you may make the next observation by clicking on the Next button. Shecin, below. When you hre finhed hking hediags, you muy gitit the propem hy selocting Finthe tred from the menn. 7. In order to make the aimultion more realistic, ovoy aow aud then, you get a blarie screen and a measage about "cloudy weather" Sugt wite "OMLYMr" in the space provided: dont enter zaro, seeause 2 ion th zept Go on to the next neading. Plotting the Mete Plot the data for the moon you chose on the graph paper provided. Each measurement of a moon's apparent separation from Jupiter will give you one dot on the graph for that moon. Then draw a smooth curve through the points. By plotting position versus time, you will use the data to draw a graph similar this: Each dot in the figure is one observation of the moon you ehose. Note the inregular spacing of dots, due to poor weather and other problems on some nights. The curve drawn through the points is the smooth curve that would be observed if you decreased the observation interval enough. The shepe of the curve is called a sinusoid, or sine wave. Using the data from the moon you choose. you can find the radius and pertod of the orbit. The period is the time it takes to go all the wiy around the orbit. Thus the time between two peaks is the period, P. The radius of the orbit, a, is the greatest apparent distance your moon is from Jupiter. This is also the greatest distance (in Jupiter diameters, or J.D.) the peak is from zero. You can read both a and P dircotly from your plot, as you can in the one above. Plot the data you measured, and read off the period, P and the orbital radius, a from your graph for whichever one of the four moons you chose. These values will have units of hours for the period 8 , and Jupiter Diametera (1..D.) for a. Enter your results here: P(perioid)= hours a (orbital radius) = i. Be sure to atiach your plot to this page, and write your name on your plot (in casc it gets separated from this page). In order to use Kepler's Third Law, you need to convert the period into years, using: 1 day =24 hours and 1 year =365.25 days. The orbital radius must be converted to A.U., using 1050 J.D. = A.U. Enter your converted values here: P(period)=yearsa(orbitalradius)= A.U. You now have all the information you need to find the mass of Jupiter with Kepler's Third Law, in which: M=p2a3 where: M is the mass of Jupiter in solar masses. (The Sun =1 solar mass.) a is the radius of the orbit in A.U. P is the period in years. Caleulate the mass of Jupiter, using the results from the motion of your moon. Moon: Mass Jupiter = sollar masses QUESIION: The Earthis Moon has an orbital period of 27.3 days and an clliptical orbit with a semi-major axis of 2.56103 A. U. What is the mass of the Earth? In what units? Show your work. Erample: 1. You munt fint seloct Lag fi fom the mend Uefore taleing data. You doul need to cuter your names: jugi hi, "iepumi co zet by this. 2. Choose one of the four moons. lmportante Bofore taking any data, eet lhe corresponding observation in terval: (Note to lab insmuctors: make sure the students get this right, since the data will be useless if they nse the defawit value of 2+ hours, since they are roo sparsely sampled for all the moons except (allisro.) 3. You can display the screen at four scales of magnification by clicking on the 1UOX. 200X, 300X and 400X buttons at the bottom of the screen. In order io improve the accuracy of you measurement of a moon, you showld we the langest possible magnification that leaves the moon on the screen. 4. In order to measure the apparent distance of a moon from Jupiter, move the pointer until the tip of the arrow is centered on the moon and cliek the mouse. Information about the moon will appear at the lower right corner of the sereen. This ineludes the name of the selected moon. the x location on the screen, and the apparent distance (in units of Jupiter diameters) of the moon from Jupiter. Also included is an E or Y. to signify whether the moon is east or west of Jupiter. If the moon's name does not appear, center the arrow more exactly on the moon: it should show up. Record the moon's position in the data table. Lese + for west and-for enst. For example, if Huropa were selected and it had an x=2.75W, you would enter 2.75in column 3 (position) in your Data 5 heets. 5. When you have recorded the Universal I ime and the position (or apparent distance from Jupiter) for your moon in the Data Sheets, you may make the next observation by clicking on the Next button. Shecin, below. When you hre finhed hking hediags, you muy gitit the propem hy selocting Finthe tred from the menn. 7. In order to make the aimultion more realistic, ovoy aow aud then, you get a blarie screen and a measage about "cloudy weather" Sugt wite "OMLYMr" in the space provided: dont enter zaro, seeause 2 ion th zept Go on to the next neading. Plotting the Mete Plot the data for the moon you chose on the graph paper provided. Each measurement of a moon's apparent separation from Jupiter will give you one dot on the graph for that moon. Then draw a smooth curve through the points. By plotting position versus time, you will use the data to draw a graph similar this: Each dot in the figure is one observation of the moon you ehose. Note the inregular spacing of dots, due to poor weather and other problems on some nights. The curve drawn through the points is the smooth curve that would be observed if you decreased the observation interval enough. The shepe of the curve is called a sinusoid, or sine wave. Using the data from the moon you choose. you can find the radius and pertod of the orbit. The period is the time it takes to go all the wiy around the orbit. Thus the time between two peaks is the period, P. The radius of the orbit, a, is the greatest apparent distance your moon is from Jupiter. This is also the greatest distance (in Jupiter diameters, or J.D.) the peak is from zero. You can read both a and P dircotly from your plot, as you can in the one above. Plot the data you measured, and read off the period, P and the orbital radius, a from your graph for whichever one of the four moons you chose. These values will have units of hours for the period 8 , and Jupiter Diametera (1..D.) for a. Enter your results here: P(perioid)= hours a (orbital radius) = i. Be sure to atiach your plot to this page, and write your name on your plot (in casc it gets separated from this page). In order to use Kepler's Third Law, you need to convert the period into years, using: 1 day =24 hours and 1 year =365.25 days. The orbital radius must be converted to A.U., using 1050 J.D. = A.U. Enter your converted values here: P(period)=yearsa(orbitalradius)= A.U. You now have all the information you need to find the mass of Jupiter with Kepler's Third Law, in which: M=p2a3 where: M is the mass of Jupiter in solar masses. (The Sun =1 solar mass.) a is the radius of the orbit in A.U. P is the period in years. Caleulate the mass of Jupiter, using the results from the motion of your moon. Moon: Mass Jupiter = sollar masses QUESIION: The Earthis Moon has an orbital period of 27.3 days and an clliptical orbit with a semi-major axis of 2.56103 A. U. What is the mass of the Earth? In what units? Show your work. Erample
Step by Step Solution
There are 3 Steps involved in it
Step: 1

Get Instant Access to Expert-Tailored Solutions
See step-by-step solutions with expert insights and AI powered tools for academic success
Step: 2

Step: 3
Ace Your Homework with AI
Get the answers you need in no time with our AI-driven, step-by-step assistance
Get Started
Introduction To Chemical Engineering Thermodynamics
Authors: J.M. Smith, Mark Swihart Hendrick C. Van Ness, Michael Abbott
9th International Edition
1260597687, 978-1260597684