Answered step by step
Verified Expert Solution
Link Copied!

Question

1 Approved Answer

Estimation of the Population Mean of Soft Plaque Deposit (Confidence Interval of the Mean). Estimation of the Population Proportion of Soft Plaque Deposit (Confidence Interval

Estimation of the Population Mean of Soft Plaque Deposit (Confidence Interval of the Mean). Estimation of the Population Proportion of Soft Plaque Deposit (Confidence Interval of the Proportion).

?
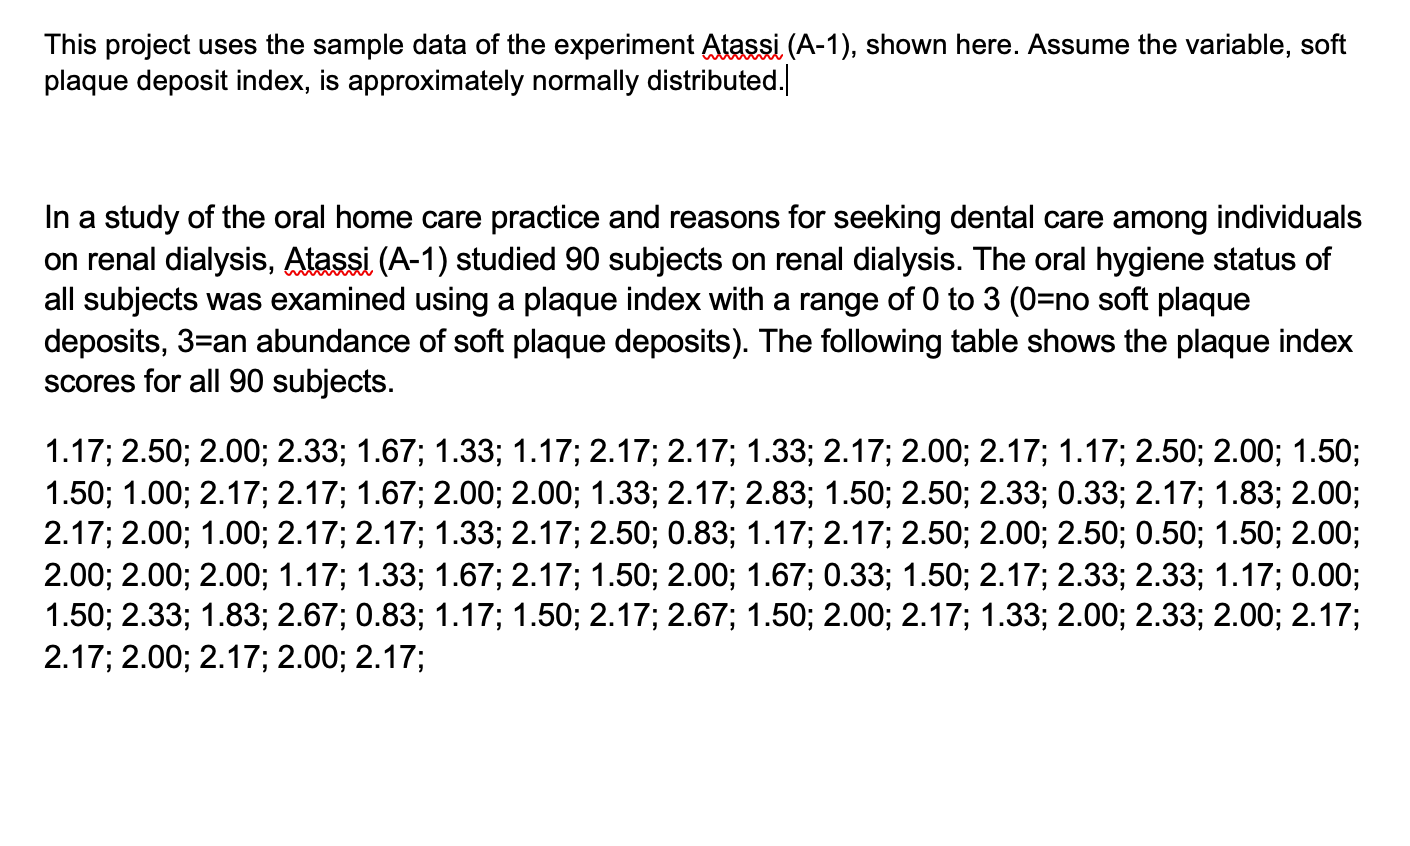
image text in transcribedimage text in transcribed
This project uses the sample data of the experiment mam-1), shown here. Assume the variable, soft plaque deposit index, is approximately normally distributedl In a study of the oral home care practice and reasons for seeking dental care among individuals on renal dialysis, Agassi, (A-1) studied 90 subjects on renal dialysis. The oral hygiene status of all subjects was examined using a plaque index with a range of O to 3 (O=no soft plaque deposits, 3=an abundance of soft plaque deposits). The following table shows the plaque index scores for all 90 subjects. 1.17; 2.50; 2.00; 2.33; 1.67; 1.33; 1.17; 2.17; 2.17; 1.33; 2.17; 2.00; 2.17; 1.17; 2.50; 2.00; 1.50; 1.50; 1.00; 2.17; 2.17; 1.67; 2.00; 2.00; 1.33; 2.17; 2.83; 1.50; 2.50; 2.33; 0.33; 2.17; 1.83; 2.00; 2.17; 2.00; 1.00; 2.17; 2.17; 1.33; 2.17; 2.50; 0.83; 1.17; 2.17; 2.50; 2.00; 2.50; 0.50; 1.50; 2.00; 2.00; 2.00; 2.00; 1.17; 1.33; 1.67; 2.17; 1.50; 2.00; 1.67; 0.33; 1.50; 2.17; 2.33; 2.33; 1.17; 0.00; 1.50; 2.33; 1.83; 2.67; 0.83; 1.17; 1.50; 2.17; 2.67; 1.50; 2.00; 2.17; 1.33; 2.00; 2.33; 2.00; 2.17; 2.17; 2.00; 2.17; 2.00; 2.17; 1. Compute a sample proportion of your choice (pick a certain index, count how many times it comes up in the sample, divide this frequency by sample size). 2. Describe the variable. 3. Describe the confidence level you are taking and its specific meaning. 4. Show the confidence interval formula that you are using. 5. Show the reliability coefficient (critical value). 6. Show all the pertinent computations using the equation editor. 7. Draw a conclusion in the context of the experiment

Step by Step Solution

There are 3 Steps involved in it

Step: 1

blur-text-image

Get Instant Access to Expert-Tailored Solutions

See step-by-step solutions with expert insights and AI powered tools for academic success

Step: 2

blur-text-image_2

Step: 3

blur-text-image_3

Ace Your Homework with AI

Get the answers you need in no time with our AI-driven, step-by-step assistance

Get Started

Recommended Textbook for

Beginning Algebra A Text/Workbook

Authors: Charles P McKeague

2nd Edition

1483271242, 9781483271248

More Books

Students also viewed these Mathematics questions