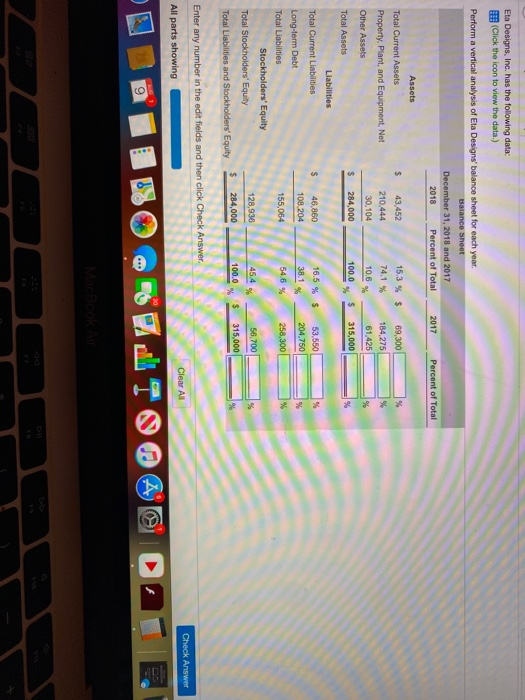
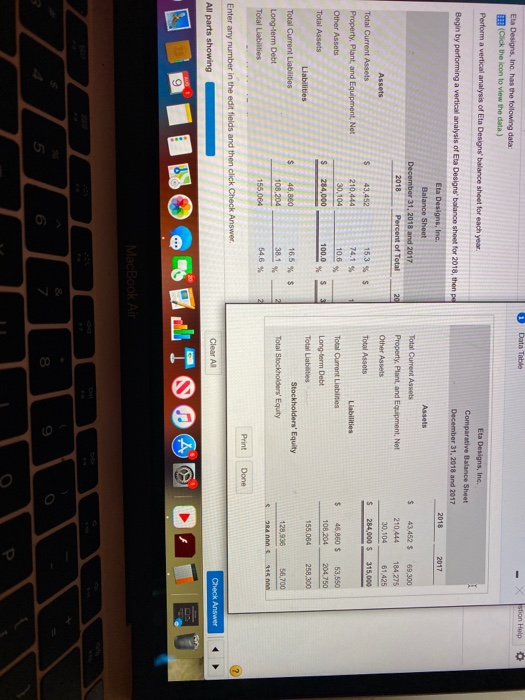
Eta Designs, Inc. has the following data: (Click the icon to view the data.) Perform a vertical analysis of Eta Designs' balance sheet for each year, Balance sheet December 31, 2018 and 2017 2018 Percent of Total 2017 Percent of Total Assets s Total Current Assets Property, Plant, and Equipment. Net Other Assets 43,452 210,444 30.104 15.3 %$ 74.1 % 69,300 184,275 61,425 10.6% $ 284,000 100.0 $ 315,000 s 16.5 % $ % 46,860 108.204 53,550 204,750 38.1 % % Total Assets Liabilities Total Current Liabilities Long-term Debt Total Liabilities Stockholders' Equity Total Stockholders' Equity 155,064 54.6 % 258,300 % 45.4 56,700 128,936 284,000 $ 100.0 % 315,000 Total Liabilities and Stockholders' Equity Enter any number in the edit fields and then click Check Answer. Clear All Check Answer All parts showing E 1 Data Table stion Help Eta Designs, Inc. has the following data: (Click the icon to view the data.) Perform a vertical analysis of Eta Designs' balance sheet for each year Eta Designs, Inc. Comparative Balance Sheet December 31, 2018 and 2017 2018 2017 Begin by performing a vertical analysis of Eta Designer balance sheet for 2018, then a Eta Designs, Inc. Balance Sheet December 31, 2018 and 2017 2018 Percent of Total Assets $ 20 Total Current Assets Property. Plant, and Equipment. Net Other Assets 43.452 5 210.444 30,104 69,300 184,275 61.425 Assets Total Current Assets Property. Plant, and Equipment, Net $ 43.652 $ Total Assets 284,000 $ 315,000 153 % $ 74.1 % 10.6 210,444 30,104 Liabilities Other Assets $ 46,850 $ 108,204 53,550 204,750 284,000 100.0 Total Assets Liabilities Total Current Liabilities Total Current Liabilities Long term Debt Total Liabilities Stockholders' Equity Total Stockholders' Equity 155,064 258,300 $ 16.5 % $ 46,860 108,204 128,936 38.1 56,700 Long-term Debt Total Liabilities Ann 115 155,064 54 6 % 2 Print Done Enter any number in the edit fields and then click Check Answer Clear All Check Answer All parts showing A 9 MacBook Air 8