Evaluate Free Cash Flow, Dupont Analysis
1) Base Case 2) Best Case 3) Worst Case


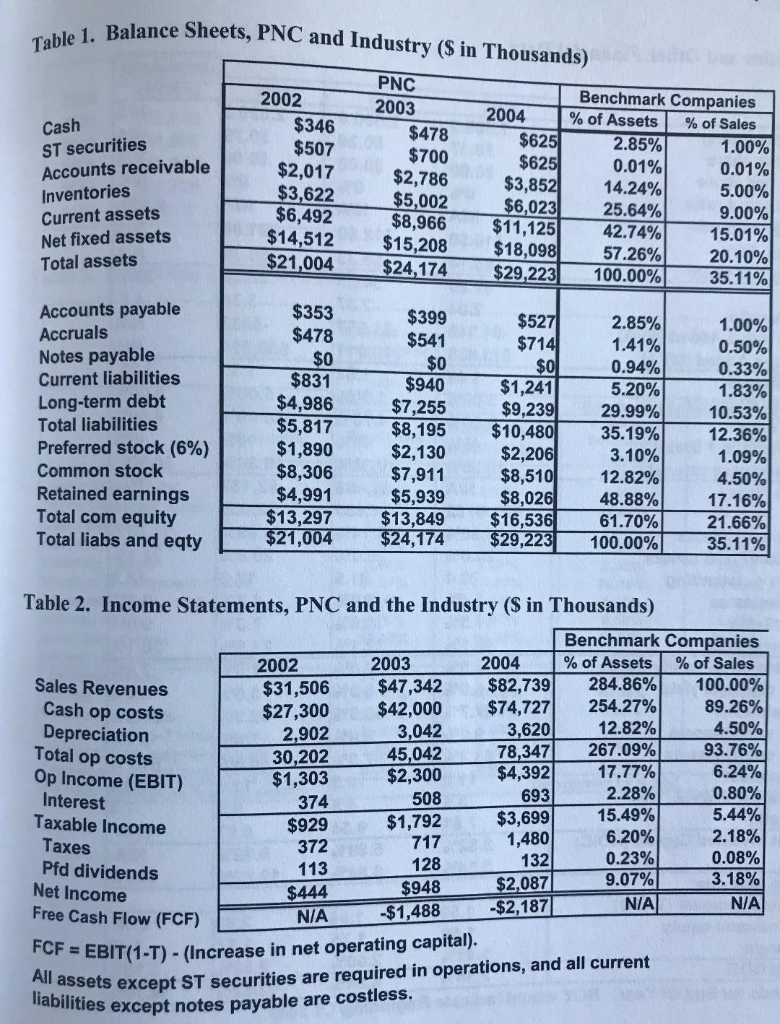
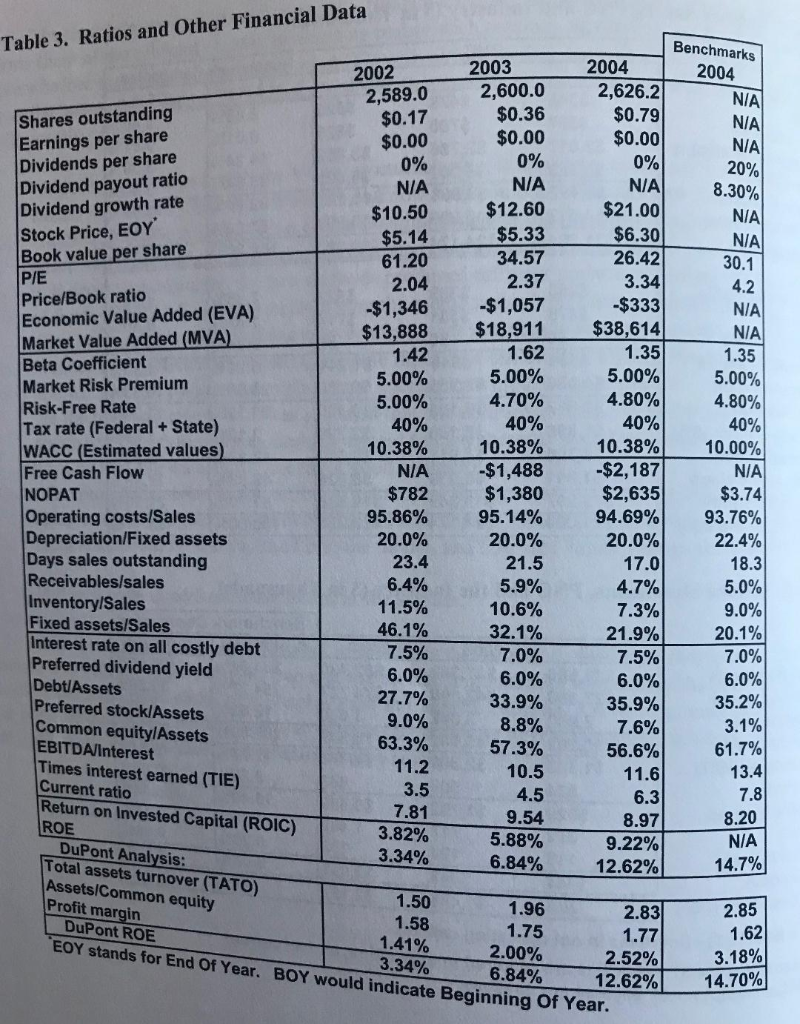
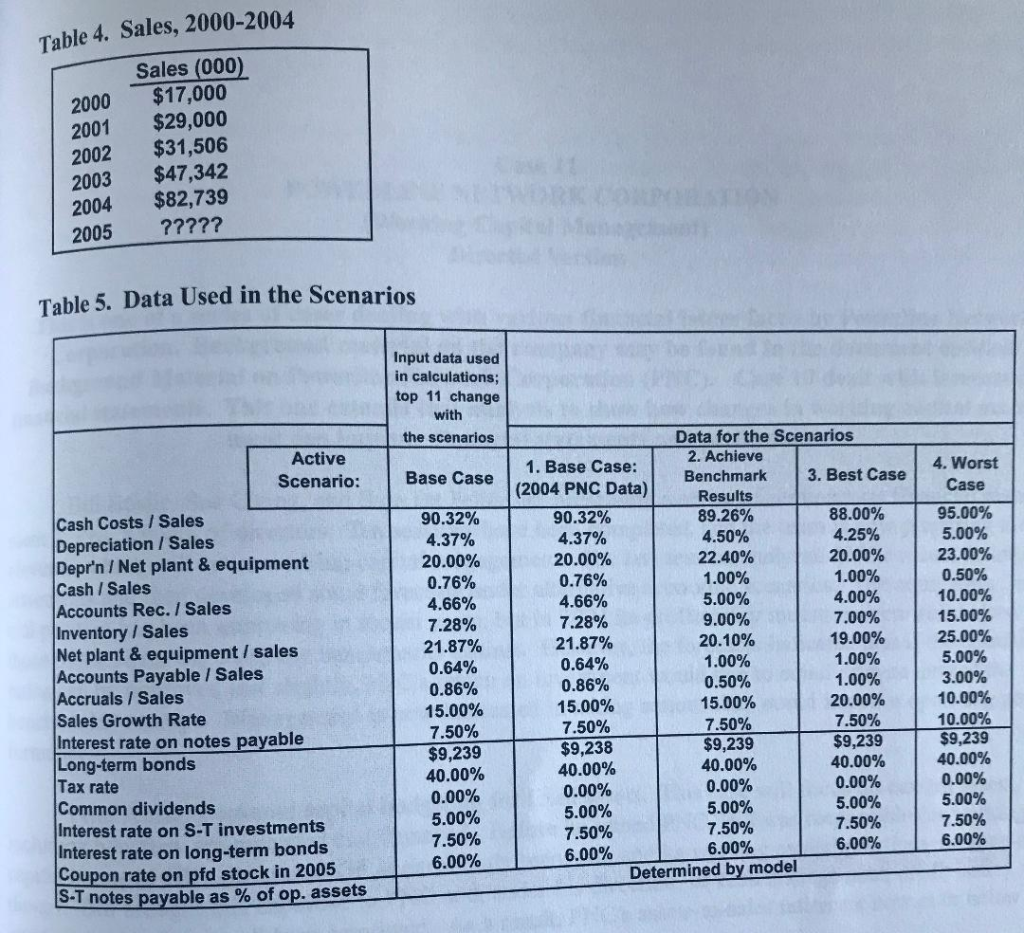
ance Sheets, PNC and Industry (S in Thousands) 2002 Benchmark Companies % of Assets 1 % of Sales 2003 2004 Ca ST securities Accounts receivable Inventories Current assets Net fixed assets Total assets 2.85% $507 $2,017 $3,622 $6,492 $14,512 $2,786 $5,002 $8,966 $15,208 $3,852 $6,023 $11,129 $18,098| 14.24% 25.64% 42.74%) 57.26% 5.00% 9.00% 15.01% 20.10% $21.004 $24.174 $29.223 100.00% 35.11 Accounts payable Accruals Notes payable Current liabilities Long-term debt Total liabilities Preferred stock (6%) Common stock Retained earnings Total com equity Total liabs and eqty $353 $47 $399 $541 $0 $714 $0 $1,241 $9,239 $10,480| $2,206 0.33% $4,986 $5,817 $1,890 $8,306 $4,991 $13,297 $21,004 $7,255 $8,195 29.99% 35.19% 10.53% 12.36% $7,911 $5,939 $13,849 $24,174 $851 12.82% 48.88% 61.70%| 00.00 $8,026 $16,536| $29,223 17.16% 21.66% 35 11% Table 2. Income Statements, PNC and the Industry (S in Thousands) Benchmark Companies % of Assets 1 % of Sales 100.00% 89.26% 93.76% 2004 2003 2002 284.86%) 254.27%) Sales Revenues $47,342 $42,000 $82,739 $31,506 $27,300 2,902 30,202 $1,303 $74,727| 3,620 Cash op costs Depreciation 12.82% 3,042 45,042 $2,300 78,347| $4,392| 267.09%) Total op costs 17.77% 15.49% 0.23% 6.24% Op Income (EBIT) Interest $3,699 1,480 Taxable Income $1,792 $929 Taxes Pfd dividends 0.08% 9.07%3,18% $2,087 -$2,187 $948 $1,488 Net Income $444 Free Cash Flow (FCF) = EBIT(1-T)-(Increase in net operating capital). assets except ST securities are required in operations, and all current lities except notes payable are costless. ll liabil Table 3. Ratios and Other Financial Data Benchmarks 2004 2003 2004 2002 2,600.0 $0.36 2,626.2 2,589.0 Shares outstanding Earnings per share Dividends per share Dividend payout ratio Dividend growth rate Stock Price, EOY Book value per share 0% NIA 0 N/A 8.30% $10.50$12.60 $21.00 $5.33 26.42 3.34 $333 $13,888 $18,911 $38,614 61.20 Price/Book ratio Economic Value Added (EVA) Market Value Added (MVA) Beta Coefficient Market Risk Premium Risk-Free Rate Tax rate (Federal + State) WACC (Estimated values Free Cash Flow NOPAT Operating costs/Sales Depreciation/Fixed assets Days sales outstanding Receivables/sales Inventory/Sales Fixed assets/Sales Interest rate on all costly debt $1,346 -$1,057 5.00% 4.80% 5.00% 5.00% 5.00% 470% 10.38% -$1,488 $1,380 95.14% 20.0% 10.38%) -$2,187 $2,635 94.69%) 20.0% 10.38% N/A $782 95.86% 20.0% 23.4 10.00% 93.76% 11.5% 32.1% 0 Preferred dividend yield 0 Debt/Assets Preferred stock/Assets Common equitylAssets EBITDA/Interest Times interest earned (TIE) Current ratio Return on Invested Capital (ROIC) 27 7% 33.9% 35.9%) 35.2% 63.3% 61.7%. 57.3% 10.5 4.5 56.6% 3.82% 5.88% 9.22% 12.62% DuPont Analysis Total assets turnover (TATO) Assets/Common equity Profit margin DuPont ROE Y stands for End Of Year. 2.00% 2.52% 12.62% 3.34% BOY would indicate Beginning of Year. 6.84% 14.70% Table 4. Sales, 2000-2004 Sales (000) 2000 $17,000 2001 $29,000 2002 $31,506 2003 $47,342 2004 $82,739 2005 ????? Table 5. Data Used in the Scenarios Input data used in calculations; top 11 change the scenarios Data for the Scenarios Active Scenario: 2. Achieve 1. Base Case: (2004 PNC Data)Benchmark 3. Best Case 4. Worst Case 95.00% 5.00% Cash Costs / Sales Depreciation / Sales Depr'n /Net plant & equipment Cash Sales Accounts Rec. I Sales Inventory / Sales Net plant & equipment / sales Accounts Payable I Sales Accruals Sales Sales Growth Rate Interest rate on notes payable Long-term bonds 90.32% 90.32% 437% 20.00% 0.76% 89.26% 4.50% 22.40% 1.00% 4.25% 20.00% 1.00% 20.00% 0.76% 4.66% 7.28% 21.87% 10.00% 15.00% 7.28% 21.87% 20.10% 19.00% 1.00% 5.00% 3.00% 10.00% 1 0.00% 0.50% 15.00% 7.50% $9,239 40.00% 0.00% 0.86% 15.00% 7 .50% $9,238 40.00% 0.86% 15.00% 7 20.00% $9,239 40.00% 0.00% 5.00% $9,239 50,239 140.00% 40.00% Common dividends Interest rate on S-T investments Interest rate on long-term bonds Coupon rate on pfd stock in 2005 5.00% 7.50% 7.50% 6.00% | 6.00% 6.00% Determined by model rnotes payable as % of op. assets ance Sheets, PNC and Industry (S in Thousands) 2002 Benchmark Companies % of Assets 1 % of Sales 2003 2004 Ca ST securities Accounts receivable Inventories Current assets Net fixed assets Total assets 2.85% $507 $2,017 $3,622 $6,492 $14,512 $2,786 $5,002 $8,966 $15,208 $3,852 $6,023 $11,129 $18,098| 14.24% 25.64% 42.74%) 57.26% 5.00% 9.00% 15.01% 20.10% $21.004 $24.174 $29.223 100.00% 35.11 Accounts payable Accruals Notes payable Current liabilities Long-term debt Total liabilities Preferred stock (6%) Common stock Retained earnings Total com equity Total liabs and eqty $353 $47 $399 $541 $0 $714 $0 $1,241 $9,239 $10,480| $2,206 0.33% $4,986 $5,817 $1,890 $8,306 $4,991 $13,297 $21,004 $7,255 $8,195 29.99% 35.19% 10.53% 12.36% $7,911 $5,939 $13,849 $24,174 $851 12.82% 48.88% 61.70%| 00.00 $8,026 $16,536| $29,223 17.16% 21.66% 35 11% Table 2. Income Statements, PNC and the Industry (S in Thousands) Benchmark Companies % of Assets 1 % of Sales 100.00% 89.26% 93.76% 2004 2003 2002 284.86%) 254.27%) Sales Revenues $47,342 $42,000 $82,739 $31,506 $27,300 2,902 30,202 $1,303 $74,727| 3,620 Cash op costs Depreciation 12.82% 3,042 45,042 $2,300 78,347| $4,392| 267.09%) Total op costs 17.77% 15.49% 0.23% 6.24% Op Income (EBIT) Interest $3,699 1,480 Taxable Income $1,792 $929 Taxes Pfd dividends 0.08% 9.07%3,18% $2,087 -$2,187 $948 $1,488 Net Income $444 Free Cash Flow (FCF) = EBIT(1-T)-(Increase in net operating capital). assets except ST securities are required in operations, and all current lities except notes payable are costless. ll liabil Table 3. Ratios and Other Financial Data Benchmarks 2004 2003 2004 2002 2,600.0 $0.36 2,626.2 2,589.0 Shares outstanding Earnings per share Dividends per share Dividend payout ratio Dividend growth rate Stock Price, EOY Book value per share 0% NIA 0 N/A 8.30% $10.50$12.60 $21.00 $5.33 26.42 3.34 $333 $13,888 $18,911 $38,614 61.20 Price/Book ratio Economic Value Added (EVA) Market Value Added (MVA) Beta Coefficient Market Risk Premium Risk-Free Rate Tax rate (Federal + State) WACC (Estimated values Free Cash Flow NOPAT Operating costs/Sales Depreciation/Fixed assets Days sales outstanding Receivables/sales Inventory/Sales Fixed assets/Sales Interest rate on all costly debt $1,346 -$1,057 5.00% 4.80% 5.00% 5.00% 5.00% 470% 10.38% -$1,488 $1,380 95.14% 20.0% 10.38%) -$2,187 $2,635 94.69%) 20.0% 10.38% N/A $782 95.86% 20.0% 23.4 10.00% 93.76% 11.5% 32.1% 0 Preferred dividend yield 0 Debt/Assets Preferred stock/Assets Common equitylAssets EBITDA/Interest Times interest earned (TIE) Current ratio Return on Invested Capital (ROIC) 27 7% 33.9% 35.9%) 35.2% 63.3% 61.7%. 57.3% 10.5 4.5 56.6% 3.82% 5.88% 9.22% 12.62% DuPont Analysis Total assets turnover (TATO) Assets/Common equity Profit margin DuPont ROE Y stands for End Of Year. 2.00% 2.52% 12.62% 3.34% BOY would indicate Beginning of Year. 6.84% 14.70% Table 4. Sales, 2000-2004 Sales (000) 2000 $17,000 2001 $29,000 2002 $31,506 2003 $47,342 2004 $82,739 2005 ????? Table 5. Data Used in the Scenarios Input data used in calculations; top 11 change the scenarios Data for the Scenarios Active Scenario: 2. Achieve 1. Base Case: (2004 PNC Data)Benchmark 3. Best Case 4. Worst Case 95.00% 5.00% Cash Costs / Sales Depreciation / Sales Depr'n /Net plant & equipment Cash Sales Accounts Rec. I Sales Inventory / Sales Net plant & equipment / sales Accounts Payable I Sales Accruals Sales Sales Growth Rate Interest rate on notes payable Long-term bonds 90.32% 90.32% 437% 20.00% 0.76% 89.26% 4.50% 22.40% 1.00% 4.25% 20.00% 1.00% 20.00% 0.76% 4.66% 7.28% 21.87% 10.00% 15.00% 7.28% 21.87% 20.10% 19.00% 1.00% 5.00% 3.00% 10.00% 1 0.00% 0.50% 15.00% 7.50% $9,239 40.00% 0.00% 0.86% 15.00% 7 .50% $9,238 40.00% 0.86% 15.00% 7 20.00% $9,239 40.00% 0.00% 5.00% $9,239 50,239 140.00% 40.00% Common dividends Interest rate on S-T investments Interest rate on long-term bonds Coupon rate on pfd stock in 2005 5.00% 7.50% 7.50% 6.00% | 6.00% 6.00% Determined by model rnotes payable as % of op. assets


