Financial Statement Case 17-1
Requirements - Please note for this assignment you must use spreadsheet software (Excel, Google Sheets, etc)
- Compute trend analyses for Sales and Net earnings / (loss). Use 2017 as the base year. What is the most notable aspect of these data?
- Perform a vertical analysis for Target Corporations balance sheet as of February 1, 2020 (fiscal year 2019), and February 2, 2019 (fiscal year 2018). Include only these main categories:
| Assets: |
| Total current assets |
| Property and equipment, net |
| Noncurrent assets of discontinued operations |
| Other noncurrent assets |
| Total assets |
| Liabilities and shareholders investment: |
| Total current liabilities |
| Total noncurrent liabilities |
| Total shareholders investment |
| Total liabilities and shareholders investment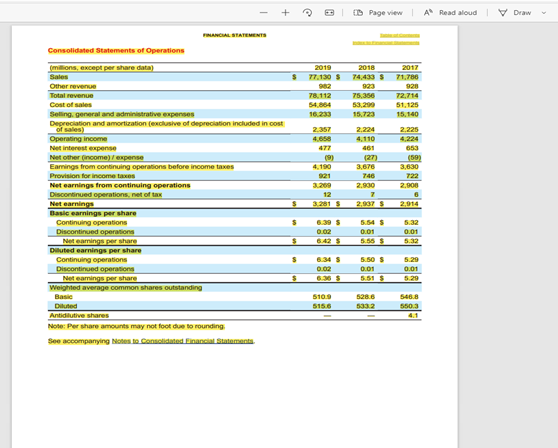 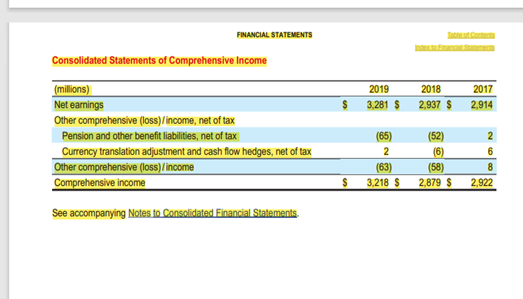 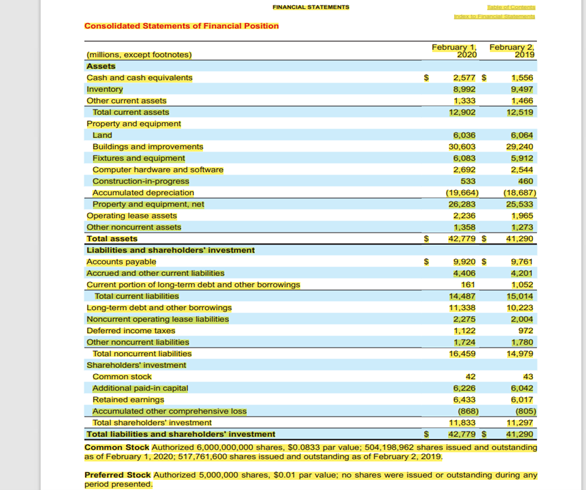  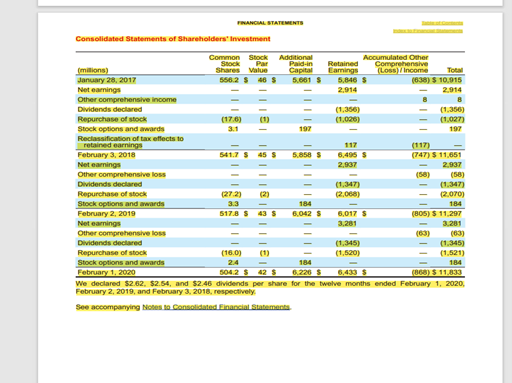 |
B OD Page view A Read aloud Draw FINANCIAL STATEMENTS Consolidated Statements of Operations $ 2019 2018 2017 77.130 $ 74,433 $ 71,786 2 928 78.112 75.356 54.854 53,200 51,125 16.233 15.723 15.140 72.714 2.357 2.225 477 (9) 4.190 milions, except per share data) Sales Other revenue Total revenue Cost of sales Selling general and administrative expenses Depreciation and amortization (exclusive of depreciation included in cost Operating income Net interest expense Net other income) / expense Earnings from continuing operations before income taxes Provision for income taxes Net earnings from continuing operations Discontinued operations, net of tax Net earnings Basic earnings per share Continuing operations Discontinued operations Net earnings per share Diluted earnings per share Continuing operations Discontinued operations Noteaming por share Weighted average common shares outstanding 2.224 4.110 461 (27) 3,676 746 2.900 7 653 (59) 3,630 722 2.908 3.269 12 3.281 $ $ 2.914 $ 0.02 5.54 $ 0.01 5.55S 5.32 0.01 5.32 $ $ 6.345 0.02 MS 5.50 $ 0.01 5.51 $ 5.29 0.01 $ 5109 515.6 5286 5332 546.8 5503 Diluted Antidilutive shares Note: Per share amounts may not foot due to rounding See accompanying Notes to Consolidated Financial Statements FINANCIAL STATEMENTS Consolidated Statements of Comprehensive Income 2019 3,281 $ 2018 2,937 $ 2017 2.914 $ (millions) Net earnings Other comprehensive (loss)/income, net of tax Pension and other benefit liabilities, net of tax Currency translation adjustment and cash flow hedges, net of tax Other comprehensive (loss)/income Comprehensive income (52) 2 6 (65) 2 (63) 3.218 $ (6) (58) 2,879 $ 8 2,922 $ See accompanying Notes to Consolidated Financial Statements. FINANCIAL STATEMENTS Consolidated Statements of Financial Position 533 February 1 February 2, (millions, except footnotes) 2020 2010 Assets Cash and cash equivalents 2.577 $ 1.556 Inventory 8,992 9,497 Other current assets 1,333 1,466 Total current assets 12,902 12,519 Property and equipment Land 6.036 6,064 Buildings and improvements 30,603 29.240 Fixtures and equipment 6,083 5,912 Computer hardware and software 2,692 2,544 Construction in-progress 460 Accumulated depreciation (19.664) (18,687) Property and equipment, net 26,283 25,533 Operating lease assets 2,236 1.965 Other noncurrent assets 1.358 1,273 Total assets 42.779 $ 41.290 Liabilities and shareholders' investment Accounts payable 9.920 S 9,761 Accrued and other current liabilities 4,406 4,201 Current portion of long-term debt and other borrowings 161 1,052 Total current liabilities 14,487 15.014 Long-term debt and other borrowings 11,338 10.223 Noncurrent operating lease liabilities 2.275 2.004 Deferred income taxes 972 Other noncurrent liabilities 1.724 1.780 Total noncurrent liabilities 16,459 14.979 Shareholders investment Common stock 42 43 Additional paid-in capital 6.226 6,042 Retained earnings 6,433 6.017 Accumulated other comprehensive loss (868) (805) Total shareholders' investment 11,833 Total liabilities and shareholders' investment 42,779 $ 41,290 Common Stock Authorized 6,000,000,000 shares. $0.0833 par value: 504,198,962 shares issued and outstanding as of February 1, 2020; 517,761,600 shares issued and outstanding as of February 2, 2019, Preferred Stock Authorized 5,000,000 shares, $0.01 par value; no shares were issued or outstanding during any period presented 1.122 11.297 FINANCIAL STATEMENTS 2019 2018 2017 2.9375 2,914 3.2815 12 2.950 Consolidated Statements of Cash Flows milions Operating activities Esmings from discontinued operations, not to Netcarrings from continuing operations Adjustments to reconcile net earnings to cash provided by operations Depreciation and on Share-based compensationer Deferred income Los onde extinguishment Noncasses and there Changes in operating 2.604 2.4 24 10 200 09001 18 140 1.127 5.970 5.973 3.071 (3.516) 85 SI 31 20 (294) 15 0.416) 55 - 2005 Accounts payable Accrued and others Cash provided by operating contentions Sath provided by penting activities discontinued operations Cash provided by operation linvesting activities Expenditures for property and equipment Proceeds from disposal of property and equipment Cash paid for acquisitions, net of cash sumed Cash required for investing actives Financing activities Additions to long terme Reductions of longo Dividendspard Repurchase of stock Stock options Cash required for francing activities Nel caso increase in cash and cash equivalents Cash and cash equivalents at beginning of period Cash and cash equivalents at end of period Supplemental Information interest paid, net of capitalized interest Leased stined in exchange for new francese Leated as sind in exchange for now ating lasaties 1730 2.000 3301 (2,124 90 11,606) 108 (1087) 131 2.512 2,043 2.575 4785 678 090 379 212 See accompanying Notes to consolidated Financial Statements FINANCIAL STATEMENTS Consolidated Statements of Shareholders Investment Stock (17.63 Common Stock Additional Accumulated Other (millions) Par Paid in Retained Comprehensive Shares Value Capital Earnings (Loss) Income Total January 28, 2017 556.2 $ 45 $ 6.661 S 5,846 (638) $ 10,915 Net earnings 2,914 2.914 Other comprehensive income 8 Dividends declared (1,356) (1.356) Repurchase of stock (1) (1.027) Stock options and awards 3.1 197 197 Reclassification of tax effects to retained earnings February 3, 2018 541.7 $ 45 S 5.858 6,495 5 (747) $ 11,651 Net earings 2,937 2.937 Other comprehensive loss (58) (58) Dividends declared (1.347) Repurchase of stock (272) (2) (2.068) (2.070) Stock options and awards 184 184 February 2, 2019 517.8 43 $ 6,042 6,017 S (805) $ 11.297 Net earnings 3.281 Other comprehensive loss (63) (63) Dividends declared (1.345) Repurchase of stock (16.0) (1.520) (1.521) Stock options and awards 2.4 184 184 February 1, 2020 5042 $ 42 $ 6.226 $ (863) $ 11,833 We declared $2.62, 2.54, and $2.46 dividends per share for the twelve months ended February 1, 2020, February 2, 2019, and February 3, 2018, respectively See accompanying Notes to Consolidated Financial Statements III ITIQIBIT1618 3.281 111 (1.345)


