

Question
Evaluate the liquidity position of Reactor Company relative to that of the average firm in the industry.Consider the current ratio and the quick ratio.What problems,
Evaluate the liquidity position of Reactor Company relative to that of the average firm in the industry.Consider the current ratio and the quick ratio.What problems, if any are suggested by this analysis?
Evaluate Reactor Companys performance by looking at key asset utilization ratios.Are any problems apparent from this analysis?
Evaluate the financial risk of Reactor Company by examining its times interest earned ratioand its total assets to stockholders equity ratio relative to the same industry average ratios.
Evaluate the profitability of Reactor Company relative to that of the average firm in its industry.
Give an overall evaluation of the performance of Reactor Company relative to other firms in its industry.
Construct a Du Pont chart analysis for Reactor Company. What areas appear to have the greatest need for improvement?
Reactor Companys current P/E ratio is 7 times. What factor(s) are most likely to account for this ratio relative to the higher industry average ratio?
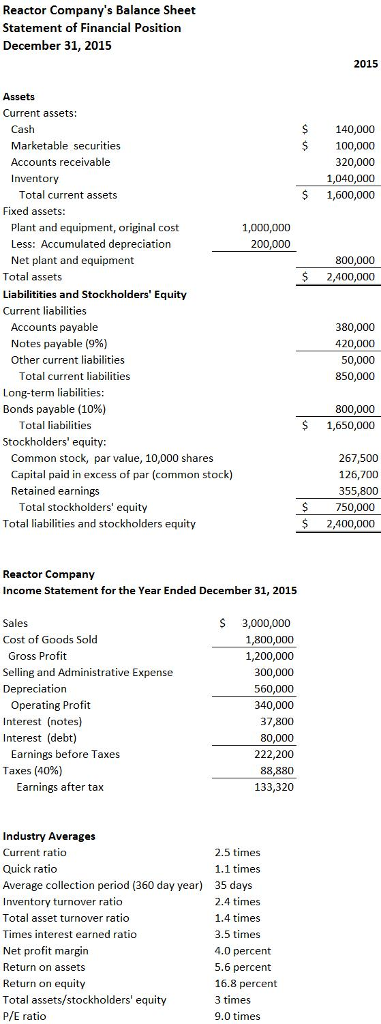
Reactor Company's Balance Sheet Statement of Financial Position December 31, 2015 Assets Current assets: Cash Marketable securities Accounts receivable nventory Total current assets Fixed assets Plant and equipment, original cost 1,000,000 Less: Accumulated depreciation 200,000 Net plant and equipment Total assets Liabilitities and Stockholders' Equity Current liabilities Accounts payable Notes payable (9% Other current liabilities Total current liabilities Long-term liabilities Bonds payable (10%) Total liabilities Stockholders' equity: Common stock, par value, 10,000 shares Capital paid in excess of par (common stock) Retained earnings Total stockholders' equity Total liabilities and stockholders equity Reactor Company Income Statement for the Year Ended December 31, 2015 3,000,000 Sales Cost of Goods Sold 800,000 Gross Profit 1,200,000 Selling and Administrative Expense 300,000 Depreciation 560,000 Operating Profit 340,000 37,800 Interest (debt) 80,000 Earnings before Taxes 222,200 Taxes (40%) 88,880 Earnings after tax 133,320 Industry Averages Current ratio 2.5 times Quick ratio 1.1 times Average collection period (360 day year) 35 days Inventory turnover ratio 2.4 times Total asset turnover ratio 1.4 times Times interest earned ratio 3.5 times et profit margi 0 percent Return on assets 5.6 percent Return on equity 16.8 percent Total assets/stockholders' equity 3 times P/E ratio 9.00 times 2015 140,000 00,000 320,000 1.040.000 1,600,000 800,000 2,400,000 380,000 420,000 50,00 850,000 800,000 1,650,000 267,500 126,700 355,800 750,000 2,400,000Step by Step Solution
There are 3 Steps involved in it
Step: 1

Get Instant Access to Expert-Tailored Solutions
See step-by-step solutions with expert insights and AI powered tools for academic success
Step: 2

Step: 3
Ace Your Homework with AI
Get the answers you need in no time with our AI-driven, step-by-step assistance
Get Started
Managerial accounting
Authors: ramji balakrishnan, k. s i varamakrishnan, Geoffrey b. sprin
1st edition
471467855, 978-0471467854