evaluate the risk of each of the weighting schemes with a risky portion of the portfolio
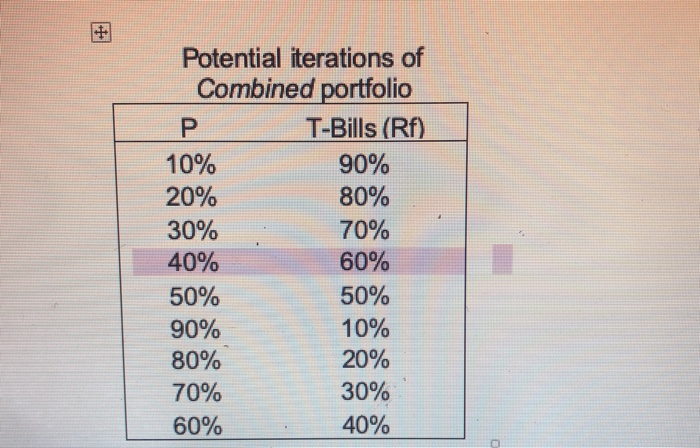
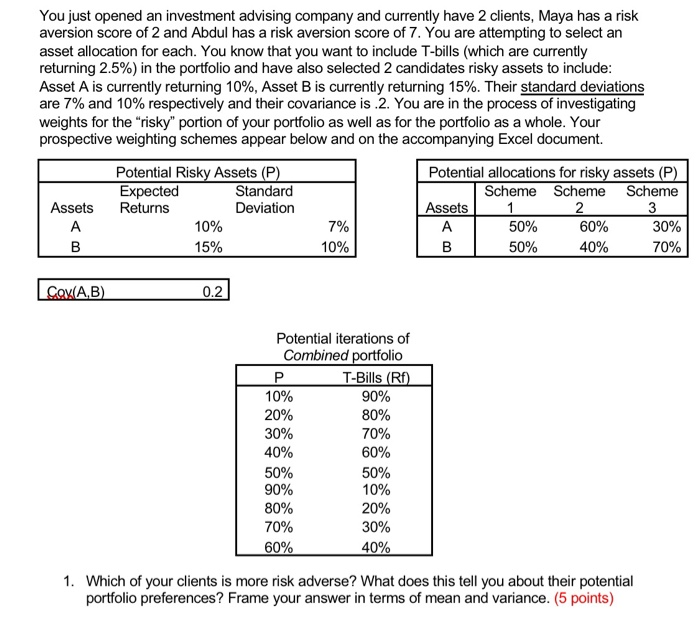
Potential iterations of Combined portfolio T-Bills (Rf) 10% 90% 20% 80% 30% 70% 40% 60% 50% 50% 90% 10% 80% 20% 70% 30% 60% 40% 2. Evaluate the risk of each of the weighting schemes for the risky portion of the portfolio: I Calculate the expected return for Scheme 1 (1 point) II. Calculate the expected return for Scheme 2 (1 point) Calculate the expected return for Scheme 3 (1 point) a. Which has the highest expected return? (1 point) How would you interpret this return in terms of utility? (1 point) I. You just opened an investment advising company and currently have 2 clients, Maya has a risk aversion score of 2 and Abdul has a risk aversion score of 7. You are attempting to select an asset allocation for each. You know that you want to include T-bills (which are currently returning 2.5%) in the portfolio and have also selected 2 candidates risky assets to include: Asset A is currently returning 10%, Asset B is currently returning 15%. Their standard deviations are 7% and 10% respectively and their covariance is 2. You are in the process of investigating weights for the "risky" portion of your portfolio as well as for the portfolio as a whole. Your prospective weighting schemes appear below and on the accompanying Excel document. Assets Potential Risky Assets (P) Expected Standard Returns Deviation 10% 15% Potential allocations for risky assets (P) Scheme Scheme Scheme Assets 50% 60% 30% 50% 40% B 10% 70% SOK(A,B) 0.2] Potential iterations of Combined portfolio T-Bills (Rf) 10% 90% 20% 80% 30% 70% 40% 60% 50% 50% 90% 80% 20% 70% 30% 60% 40% 10% 1. Which of your clients is more risk adverse? What does this tell you about their potential portfolio preferences? Frame your answer in terms of mean and variance. (5 points) Potential iterations of Combined portfolio T-Bills (Rf) 10% 90% 20% 80% 30% 70% 40% 60% 50% 50% 90% 10% 80% 20% 70% 30% 60% 40% 2. Evaluate the risk of each of the weighting schemes for the risky portion of the portfolio: I Calculate the expected return for Scheme 1 (1 point) II. Calculate the expected return for Scheme 2 (1 point) Calculate the expected return for Scheme 3 (1 point) a. Which has the highest expected return? (1 point) How would you interpret this return in terms of utility? (1 point) I. You just opened an investment advising company and currently have 2 clients, Maya has a risk aversion score of 2 and Abdul has a risk aversion score of 7. You are attempting to select an asset allocation for each. You know that you want to include T-bills (which are currently returning 2.5%) in the portfolio and have also selected 2 candidates risky assets to include: Asset A is currently returning 10%, Asset B is currently returning 15%. Their standard deviations are 7% and 10% respectively and their covariance is 2. You are in the process of investigating weights for the "risky" portion of your portfolio as well as for the portfolio as a whole. Your prospective weighting schemes appear below and on the accompanying Excel document. Assets Potential Risky Assets (P) Expected Standard Returns Deviation 10% 15% Potential allocations for risky assets (P) Scheme Scheme Scheme Assets 50% 60% 30% 50% 40% B 10% 70% SOK(A,B) 0.2] Potential iterations of Combined portfolio T-Bills (Rf) 10% 90% 20% 80% 30% 70% 40% 60% 50% 50% 90% 80% 20% 70% 30% 60% 40% 10% 1. Which of your clients is more risk adverse? What does this tell you about their potential portfolio preferences? Frame your answer in terms of mean and variance. (5 points)