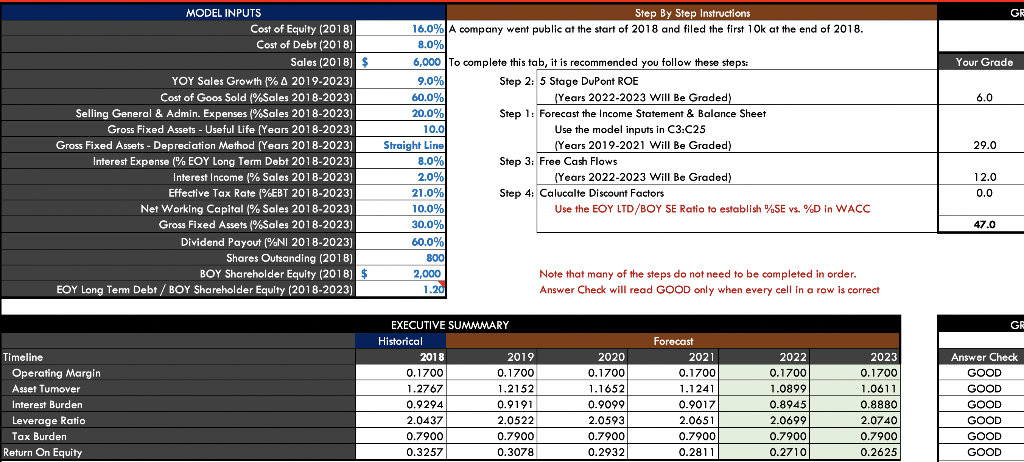
 Everything is correct accept the bottom 2 lines. I am doing it in excel so if you could tell me how to do each one once I can copy the formula. Or if you want to solve all of em that would be great too. Thank you!
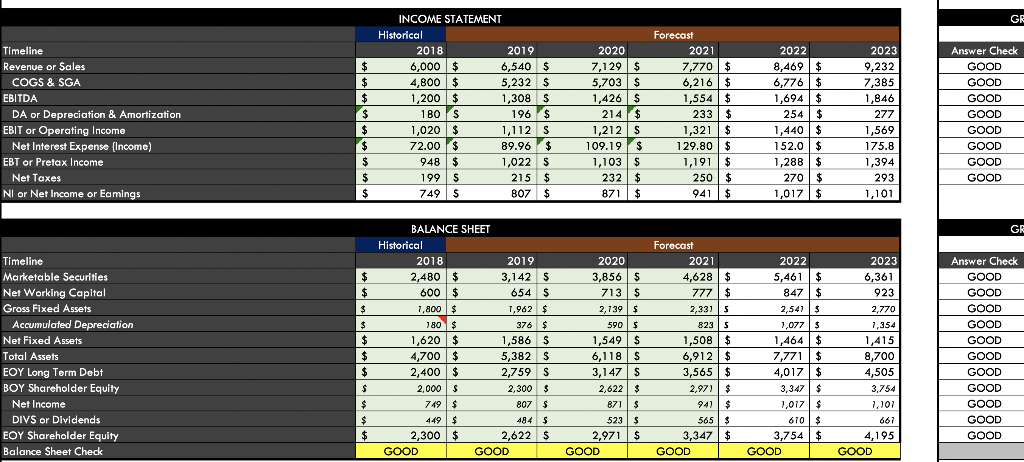
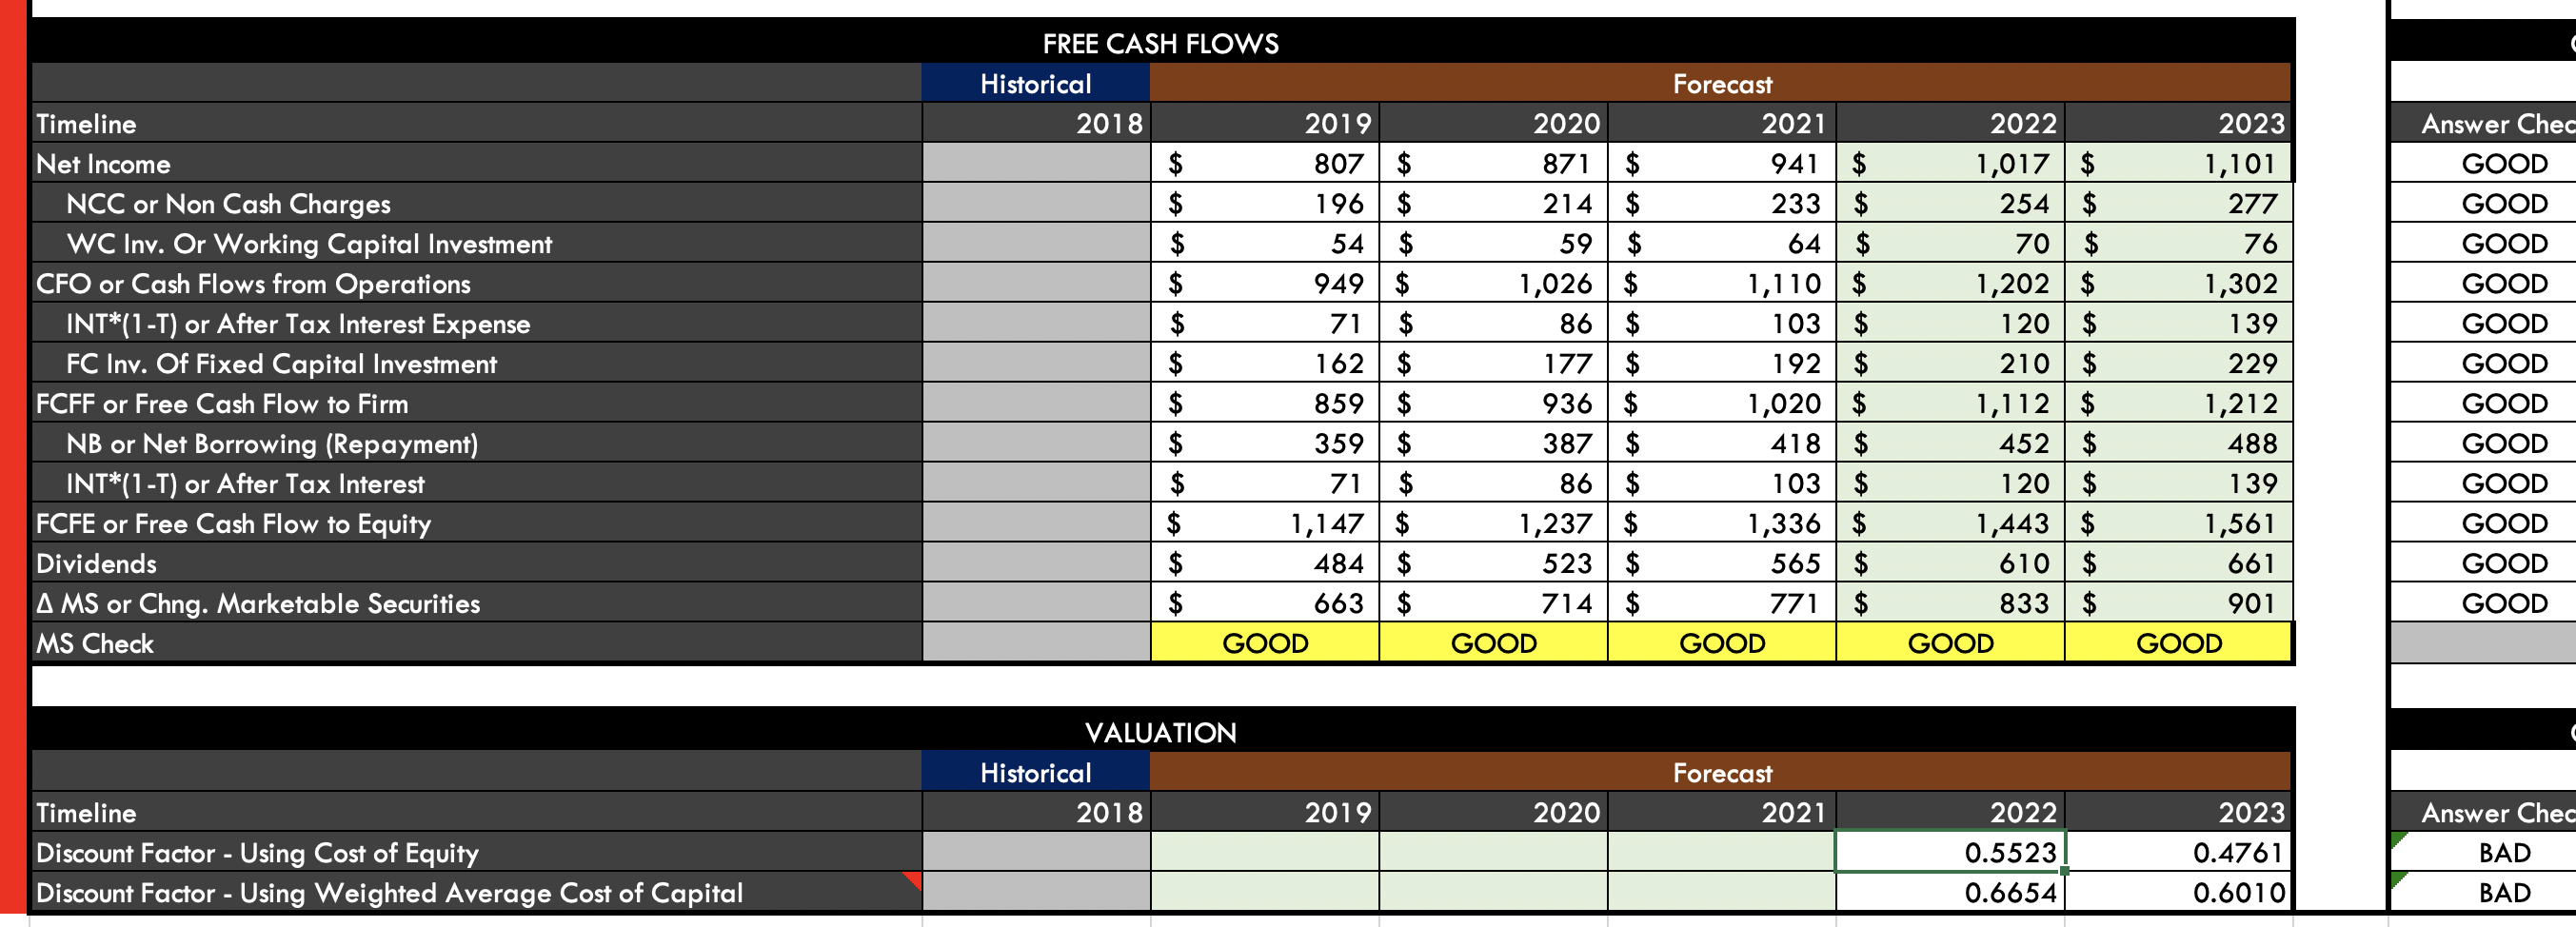
GE Your Grade 6.0 Step By Step Instructions 16.0% A company went public at the start of 2018 and filed the first 10k at the end of 2018. 8.0%) 6,000 To complete this tab, it is recommended you follow these steps: 9.0% Step 2: 5 Stage DuPont ROE 60.0% (Years 2022-2023 Will Be Graded) 20.0% Step 1: Forecast the Income Statement & Balance Sheet 100 10.0 Use the model inputs in C3:C25 htlin (Years 2019-2021 Will Be Graded) 0.070 Step 3: Free Cash Flows 2.0%) (Years 2022-2023 Will Be Graded) 21.00% 21.0% Step 4: Calucalte Discount Factors 10.0% Use the EOY LTD/BOY SE Ratio to establish %SE vs. %D in WACC 18-2023) Straight Line MODEL INPUTS Cost of Equity (2018) Cost of Debt (2018) Sales (2018) $ YOY Sales Growth L% A 2019-2023) Cost of Goos Sold Sales 2018-2023) Selling General & Admin. Expenses Sales 2018-2023) Gross Fixed Assets - Useful Life (Years 2018- Gross Fixed Assets - Depreciation Method (Years 2018-2023) Interest Expense (% EOY Long Term Debt 2018-2023) Interest Income % Sales 2018-2023) Effective Tax Rate (%EBT 2018-2023) Net Working Capital (% Sales 2018-2023) Gross Fixed Assets (Sales 2018-2023) Dividend Payout (%NI 2018-2023) Shares Outsanding (2018) BOY Shareholder Equity (2018) $ EOY Long Term Debt / BOY Shareholder Equity (2018-2023) 29.0 12.0 0.0 30.0701 47.0 60.0% 8000 2,000 1.20 Note that many of the steps do not need to be completed in order. Answer Check will read GOOD only when every cell in a row is correct GR EXECUTIVE SUMMARY Historical 2018 2019 0.1700 0.1700 1.2767 1.2152 0.9294 0.9191 2.0437 2.0522 0.7900 0.7900 0.3257 0.3078 Timeline Operating Margin Asset Tumover Interest Burden Leverage Ratio Tax Burden Return On Equity 2023 0.1700 1.0611 2020 0.1700 1.1652 0.9099 2.0593 0.7900 0.2932 Forecast 2021 0.1700 1.1241 0.9017 2.0651 0.7900 0.2811 2022 0.1700 1.0899 0.8945 2.0699 0.7900 0.2710 0.8880 Answer Check GOOD GOOD GOOD GOOD GOOD GOOD 2.0740 0.7900 0.2625 GR Timeline Revenue or Sales COGS & SGA EBITDA DA or Depreciation & Amortization EBIT or Operating Income Net Interest Expense (Income) EBT or Pretax Income Net Taxes NI or Net Income or Eamings $ $ + $ $ $ $ $ $ $ INCOME STATEMENT Historical 2018 2019 6,000 $ 6,540 $ 4,800 $ 5,232 $ 1,200 $ 200 1,308 S 100 180S 196 $ 1,020 $ 1,112 S 2000 72.00 $ 89.96 $ 948 $ s 1,022 S 199 $ 215 $ 749 $ 807 $ 2020 7,129 $ 5,703 $ 1,426 $ 214 $ c 1,212S 109.19 $ 1,103 $ 232 $ 871 $ Forecast 2021 7,770 $ 6,216 $ 1,554 $ 21 233$ 1,321 | $ 129.80 $ 1,191 $ 250 $ 941 $ 2022 8,469 $ 6,776 $ 1,694 $ 404 254 $ 1,440 $ wote 152.0 $ 1,288$ 298 2701 270 $ 1,017$ 2023 9,232 7,385 2 1,846 277 1,569 175.8 1,394 293 1,101 Answer Check GOOD GOOD COOR GOOD CO GOOD con GOOD GOOD GOOD GOOD GR $ $ $ 2023 6,361 923 $ Timeline Marketable Securities Net Working Capital Gross Fixed Assets Accumulated Depreciation Net Fixed Assets Tum Total Assets Cov EOY Long Term Debt BOY Shareholder Equity Net Income DIVS or Dividends EOY Shareholder Equity Balance Sheet Check $ $ $ BALANCE SHEET Historical 2018 2019 2,480 $ 3,142 $ 600 $ 654 $ 7,800 $ 1,962 $ 180 $ 376 $ 1,620 $ 1,586 S 4,700 $ 5,382 S 2,400$ 2,759 $ 2,000 $ 2,300 $ 749 $ 807 s 449 $ 484 5 2,300 $ 2,622 $ GOOD GOOD 2020 3,856 $ 713$ 2,1395 590 $ 1,549 $ 6,118 $ 3,147 $ 2,622 $ 871 $ 523 $ 2,971 $ GOOD Forecast 2021 4,628 $ 777 $ 2,3315 8235 1,500 $ 6,912 $ 3,565 $ 2,97) $ 941 $ 565 $ 3,347$ GOOD 2022 5,461 $ 847 $ 2,541 $ 1,077 $ 1,464 $ 7,771 $ 4,017$ 3,347 $ 1,017 $ 670 $ 3,754 $ GOOD um 2,770 7,354 1,415 8,700 4,505 3,754 1,101 661 4,195 GOOD Answer Check GOOD GOOD GOOD . GOOD GOOD GOOD 2 GOOD GOOD GOOD GOOD GOOD $ $ $ $ $ Timeline Net Income NCC or Non Cash Charges WC Inv. Or Working Capital Investment CFO or Cash Flows from Operations INT*(1-T) or After Tax Interest Expense FC Inv. Of Fixed Capital Investment FCFF or Free Cash Flow to Firm NB or Net Borrowing (Repayment) INT*(1-T) or After Tax Interest FCFE or Free Cash Flow to Equity Dividends A MS or Chng. Marketable Securities MS Check FREE CASH FLOWS Historical 2018 2019 $ 807 $ $ 196 $ $ 54 $ $ 949 $ $ 71 $ $ 162 $ 859 $ $ 359 | $ $ 71 $ $ 1,147 $ $ 484 $ $ 663 $ GOOD 2020 871 $ 214 $ 59 $ 1,026 $ 86 $ 177 $ 936 $ 387 $ 86 $ 1,237 $ 523 $ 714 $ GOOD Alta Forecast 2021 941 $ 233 $ 64 $ 1,110$ 103 $ 192 $ 1,020 $ 418 $ 103 $ 1,336 $ 565 $ 771 $ GOOD 2022 1,017 $ 254 $ 70 $ 1,202 $ 120$ 210 $ 1,112 $ 452 $ 120$ 1,443 $ 610 $ 833 $ GOOD 2023 1,101 277 76 1,302 139 229 1,212 488 139 1,561 661 901 GOOD Answer Chec GOOD GOOD GOOD GOOD GOOD GOOD GOOD GOOD GOOD GOOD GOOD GOOD VALUATION Historical 2018 Forecast 2019 2020 2021 Timeline Discount Factor - Using Cost of Equity Discount Factor - Using Weighted Average Cost of Capital 2022 0.5523 0.6654 2023 0.4761 0.6010 Answer Chec BAD BAD GE Your Grade 6.0 Step By Step Instructions 16.0% A company went public at the start of 2018 and filed the first 10k at the end of 2018. 8.0%) 6,000 To complete this tab, it is recommended you follow these steps: 9.0% Step 2: 5 Stage DuPont ROE 60.0% (Years 2022-2023 Will Be Graded) 20.0% Step 1: Forecast the Income Statement & Balance Sheet 100 10.0 Use the model inputs in C3:C25 htlin (Years 2019-2021 Will Be Graded) 0.070 Step 3: Free Cash Flows 2.0%) (Years 2022-2023 Will Be Graded) 21.00% 21.0% Step 4: Calucalte Discount Factors 10.0% Use the EOY LTD/BOY SE Ratio to establish %SE vs. %D in WACC 18-2023) Straight Line MODEL INPUTS Cost of Equity (2018) Cost of Debt (2018) Sales (2018) $ YOY Sales Growth L% A 2019-2023) Cost of Goos Sold Sales 2018-2023) Selling General & Admin. Expenses Sales 2018-2023) Gross Fixed Assets - Useful Life (Years 2018- Gross Fixed Assets - Depreciation Method (Years 2018-2023) Interest Expense (% EOY Long Term Debt 2018-2023) Interest Income % Sales 2018-2023) Effective Tax Rate (%EBT 2018-2023) Net Working Capital (% Sales 2018-2023) Gross Fixed Assets (Sales 2018-2023) Dividend Payout (%NI 2018-2023) Shares Outsanding (2018) BOY Shareholder Equity (2018) $ EOY Long Term Debt / BOY Shareholder Equity (2018-2023) 29.0 12.0 0.0 30.0701 47.0 60.0% 8000 2,000 1.20 Note that many of the steps do not need to be completed in order. Answer Check will read GOOD only when every cell in a row is correct GR EXECUTIVE SUMMARY Historical 2018 2019 0.1700 0.1700 1.2767 1.2152 0.9294 0.9191 2.0437 2.0522 0.7900 0.7900 0.3257 0.3078 Timeline Operating Margin Asset Tumover Interest Burden Leverage Ratio Tax Burden Return On Equity 2023 0.1700 1.0611 2020 0.1700 1.1652 0.9099 2.0593 0.7900 0.2932 Forecast 2021 0.1700 1.1241 0.9017 2.0651 0.7900 0.2811 2022 0.1700 1.0899 0.8945 2.0699 0.7900 0.2710 0.8880 Answer Check GOOD GOOD GOOD GOOD GOOD GOOD 2.0740 0.7900 0.2625 GR Timeline Revenue or Sales COGS & SGA EBITDA DA or Depreciation & Amortization EBIT or Operating Income Net Interest Expense (Income) EBT or Pretax Income Net Taxes NI or Net Income or Eamings $ $ + $ $ $ $ $ $ $ INCOME STATEMENT Historical 2018 2019 6,000 $ 6,540 $ 4,800 $ 5,232 $ 1,200 $ 200 1,308 S 100 180S 196 $ 1,020 $ 1,112 S 2000 72.00 $ 89.96 $ 948 $ s 1,022 S 199 $ 215 $ 749 $ 807 $ 2020 7,129 $ 5,703 $ 1,426 $ 214 $ c 1,212S 109.19 $ 1,103 $ 232 $ 871 $ Forecast 2021 7,770 $ 6,216 $ 1,554 $ 21 233$ 1,321 | $ 129.80 $ 1,191 $ 250 $ 941 $ 2022 8,469 $ 6,776 $ 1,694 $ 404 254 $ 1,440 $ wote 152.0 $ 1,288$ 298 2701 270 $ 1,017$ 2023 9,232 7,385 2 1,846 277 1,569 175.8 1,394 293 1,101 Answer Check GOOD GOOD COOR GOOD CO GOOD con GOOD GOOD GOOD GOOD GR $ $ $ 2023 6,361 923 $ Timeline Marketable Securities Net Working Capital Gross Fixed Assets Accumulated Depreciation Net Fixed Assets Tum Total Assets Cov EOY Long Term Debt BOY Shareholder Equity Net Income DIVS or Dividends EOY Shareholder Equity Balance Sheet Check $ $ $ BALANCE SHEET Historical 2018 2019 2,480 $ 3,142 $ 600 $ 654 $ 7,800 $ 1,962 $ 180 $ 376 $ 1,620 $ 1,586 S 4,700 $ 5,382 S 2,400$ 2,759 $ 2,000 $ 2,300 $ 749 $ 807 s 449 $ 484 5 2,300 $ 2,622 $ GOOD GOOD 2020 3,856 $ 713$ 2,1395 590 $ 1,549 $ 6,118 $ 3,147 $ 2,622 $ 871 $ 523 $ 2,971 $ GOOD Forecast 2021 4,628 $ 777 $ 2,3315 8235 1,500 $ 6,912 $ 3,565 $ 2,97) $ 941 $ 565 $ 3,347$ GOOD 2022 5,461 $ 847 $ 2,541 $ 1,077 $ 1,464 $ 7,771 $ 4,017$ 3,347 $ 1,017 $ 670 $ 3,754 $ GOOD um 2,770 7,354 1,415 8,700 4,505 3,754 1,101 661 4,195 GOOD Answer Check GOOD GOOD GOOD . GOOD GOOD GOOD 2 GOOD GOOD GOOD GOOD GOOD $ $ $ $ $ Timeline Net Income NCC or Non Cash Charges WC Inv. Or Working Capital Investment CFO or Cash Flows from Operations INT*(1-T) or After Tax Interest Expense FC Inv. Of Fixed Capital Investment FCFF or Free Cash Flow to Firm NB or Net Borrowing (Repayment) INT*(1-T) or After Tax Interest FCFE or Free Cash Flow to Equity Dividends A MS or Chng. Marketable Securities MS Check FREE CASH FLOWS Historical 2018 2019 $ 807 $ $ 196 $ $ 54 $ $ 949 $ $ 71 $ $ 162 $ 859 $ $ 359 | $ $ 71 $ $ 1,147 $ $ 484 $ $ 663 $ GOOD 2020 871 $ 214 $ 59 $ 1,026 $ 86 $ 177 $ 936 $ 387 $ 86 $ 1,237 $ 523 $ 714 $ GOOD Alta Forecast 2021 941 $ 233 $ 64 $ 1,110$ 103 $ 192 $ 1,020 $ 418 $ 103 $ 1,336 $ 565 $ 771 $ GOOD 2022 1,017 $ 254 $ 70 $ 1,202 $ 120$ 210 $ 1,112 $ 452 $ 120$ 1,443 $ 610 $ 833 $ GOOD 2023 1,101 277 76 1,302 139 229 1,212 488 139 1,561 661 901 GOOD Answer Chec GOOD GOOD GOOD GOOD GOOD GOOD GOOD GOOD GOOD GOOD GOOD GOOD VALUATION Historical 2018 Forecast 2019 2020 2021 Timeline Discount Factor - Using Cost of Equity Discount Factor - Using Weighted Average Cost of Capital 2022 0.5523 0.6654 2023 0.4761 0.6010 Answer Chec BAD BAD