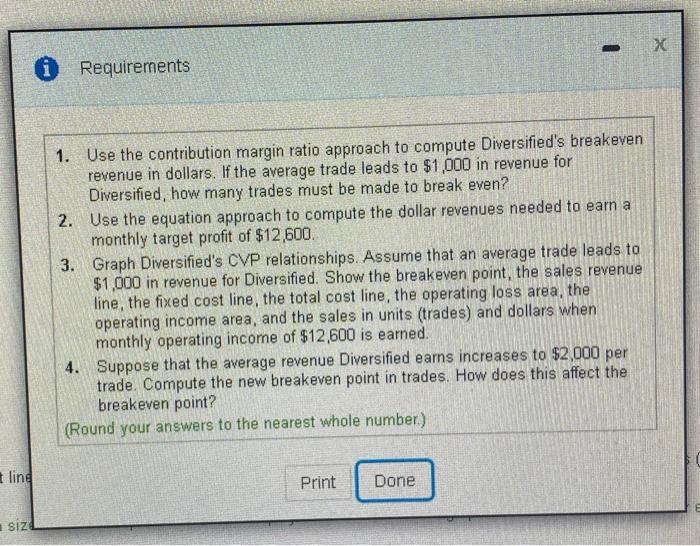
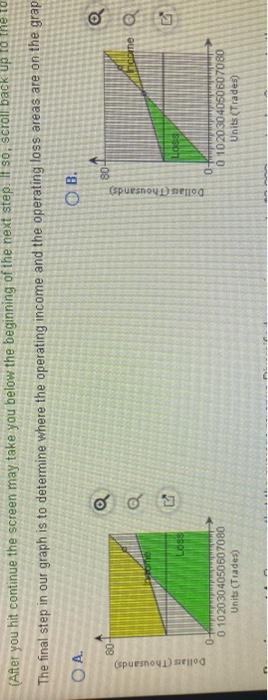
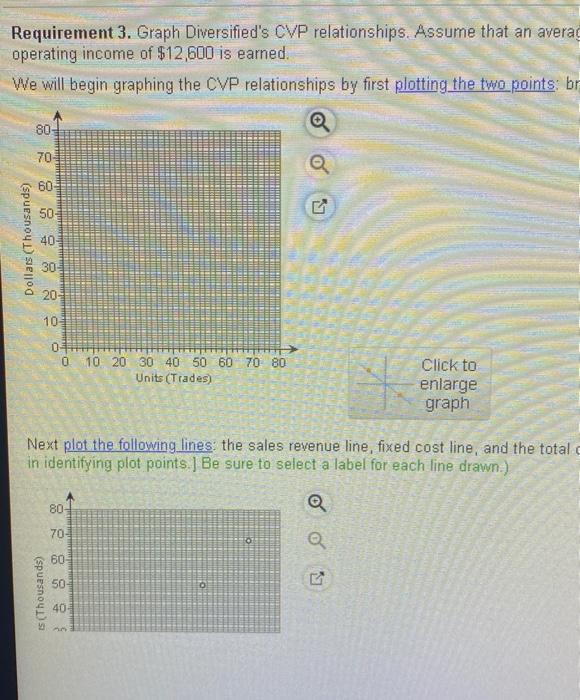
EX Requirements 1. Use the contribution margin ratio approach to compute Diversified's breakeven revenue in dollars. If the average trade leads to $1,000 in revenue for Diversified, how many trades must be made to break even? 2. Use the equation approach to compute the dollar revenues needed to earn a monthly target profit of $12,600 3. Graph Diversified's CVP relationships. Assume that an average trade leads to $1,000 in revenue for Diversified. Show the breakeven point, the sales revenue line, the fixed cost line, the total cost line, the operating loss area, the operating income area, and the sales in units (trades) and dollars when monthly operating income of $12,600 is earned 4. Suppose that the average revenue Diversified earns increases to $2,000 per trade. Compute the new breakeven point in trades. How does this affect the breakeven point? (Round your answers to the nearest whole number) ling Print Done siz! Diversified Investor Group is opening an office in Portland, Oregon, Fixed monthly costs are office rent ($8.300), depreciation on offic payments to the financial planner (8% of revenue), advertising (13% of revenue), supplies and postage (3% of revenue), and usage fe Read the requirements ($8,300), depreciation on office furniture ($2.000), utilities ($2,100), special telephone lines ($1,500), a connection with (3% of revenue), and usage fees for the telephone lines and computerized brokerage service (6% of revenue) special telephone lines ($1.500), a connection with an online brokerage service (52 700), and the salary of a financial planner ($18.400). Variable costs include erized brokerage service (6% of revenue) (After you hit continue the screen may take you below the beginning of the next step. It so, scroll back up to the to The final step in our graph is to determine where the operating income and the operating loss areas are on the grap OB. OA. 801 80- come Dollars (Thousands Dollas (Thousands) 089 0+ 0 1020304050607080 Units (Trades) O- 0 1020304050607080 Units (Trades) cared. Review the graphs and determine which has the correct shaded areas labeled for income and loss. (Enlarge each graph before selecting your ans OC OD. 80 80- Dollar (Thousands) Dollar (Thousands G 09 0-14 0 10 20 30 4050 60 70 80 Units (Trades 0 1020304050607080 Unit (Trades) Requirement 3. Graph Diversified's CVP relationships. Assume that an avera operating income of $12,600 is earned. We will begin graphing the CVP relationships by first plotting the two points: br Q 80 70 a 60 50 Dollars (Thousands) 40 30 20 10 0 0 10 20 30 40 50 60 70 80 Units (Trades) Click to enlarge graph Next plot the following lines: the sales revenue line, fixed cost line, and the total in identifying plot points ] Be sure to select a label for each line drawn.) 80 a 70 Q 60 50 LY is (Thousands) 40


