Answered step by step
Verified Expert Solution
Question
1 Approved Answer
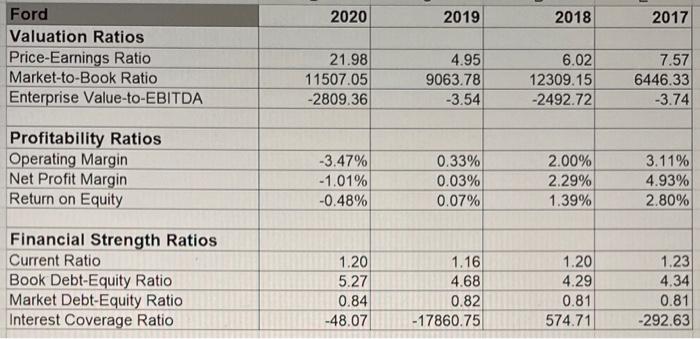
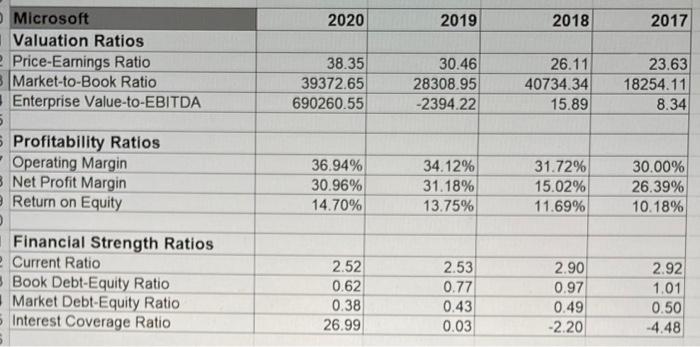
Examine the market-to-book ratios for each firm. Are either of these firms considered growth firms or value firms or neither? compare the valuation ratios of
Examine the market-to-book ratios for each firm. Are either of these firms considered "growth firms" or "value firms" or neither?
2020 2019 2018 2017 Ford Valuation Ratios Price-Earnings Ratio Market-to-Book Ratio Enterprise Value-to-EBITDA 21.98 11507.05 -2809.36 4.95 9063.78 -3.54 6.02 12309.15 -2492.72 7.57 6446.33 -3.74 Profitability Ratios Operating Margin Net Profit Margin Return on Equity -3.47% -1.01% -0.48% 0.33% 0.03% 0.07% 2.00% 2.29% 1.39% 3.11% 4.93% 2.80% Financial Strength Ratios Current Ratio Book Debt-Equity Ratio Market Debt-Equity Ratio Interest Coverage Ratio 1.20 5.27 0.84 -48.07 1.16 4.68 0.82 -17860.75 1.20 4.29 0.81 574.71 1.23 4.34 0.81 -292.63 2020 2019 2018 2017 Microsoft Valuation Ratios Price-Earnings Ratio Market-to-Book Ratio Enterprise Value-to-EBITDA 38.35 39372.65 690260.55 30.46 28308.95 -2394.22 26.11 40734.34 15.89 23.63 18254.11 8.34 Profitability Ratios Operating Margin 3 Net Profit Margin Return on Equity 36.94% 30.96% 14.70% 34.12% 31.18% 13.75% 31.72% 15.02% 11.69% 30.00% 26.39% 10.18% Financial Strength Ratios Current Ratio Book Debt-Equity Ratio Market Debt-Equity Ratio Interest Coverage Ratio 2.52 0.62 0.38 26.99 2.53 0.77 0.43 0.03 2.90 0.97 0.49 -2.20 2.92 1.01 0.50 -4.48 2020 2019 2018 2017 Ford Valuation Ratios Price-Earnings Ratio Market-to-Book Ratio Enterprise Value-to-EBITDA 21.98 11507.05 -2809.36 4.95 9063.78 -3.54 6.02 12309.15 -2492.72 7.57 6446.33 -3.74 Profitability Ratios Operating Margin Net Profit Margin Return on Equity -3.47% -1.01% -0.48% 0.33% 0.03% 0.07% 2.00% 2.29% 1.39% 3.11% 4.93% 2.80% Financial Strength Ratios Current Ratio Book Debt-Equity Ratio Market Debt-Equity Ratio Interest Coverage Ratio 1.20 5.27 0.84 -48.07 1.16 4.68 0.82 -17860.75 1.20 4.29 0.81 574.71 1.23 4.34 0.81 -292.63 2020 2019 2018 2017 Microsoft Valuation Ratios Price-Earnings Ratio Market-to-Book Ratio Enterprise Value-to-EBITDA 38.35 39372.65 690260.55 30.46 28308.95 -2394.22 26.11 40734.34 15.89 23.63 18254.11 8.34 Profitability Ratios Operating Margin 3 Net Profit Margin Return on Equity 36.94% 30.96% 14.70% 34.12% 31.18% 13.75% 31.72% 15.02% 11.69% 30.00% 26.39% 10.18% Financial Strength Ratios Current Ratio Book Debt-Equity Ratio Market Debt-Equity Ratio Interest Coverage Ratio 2.52 0.62 0.38 26.99 2.53 0.77 0.43 0.03 2.90 0.97 0.49 -2.20 2.92 1.01 0.50 -4.48 compare the valuation ratios of the two firms. how do you interpret the difference between them?
how has enterprise value for the firms changed over the 4 years? 


Step by Step Solution
There are 3 Steps involved in it
Step: 1

Get Instant Access to Expert-Tailored Solutions
See step-by-step solutions with expert insights and AI powered tools for academic success
Step: 2

Step: 3

Ace Your Homework with AI
Get the answers you need in no time with our AI-driven, step-by-step assistance
Get Started


