Answered step by step
Verified Expert Solution
Question
1 Approved Answer
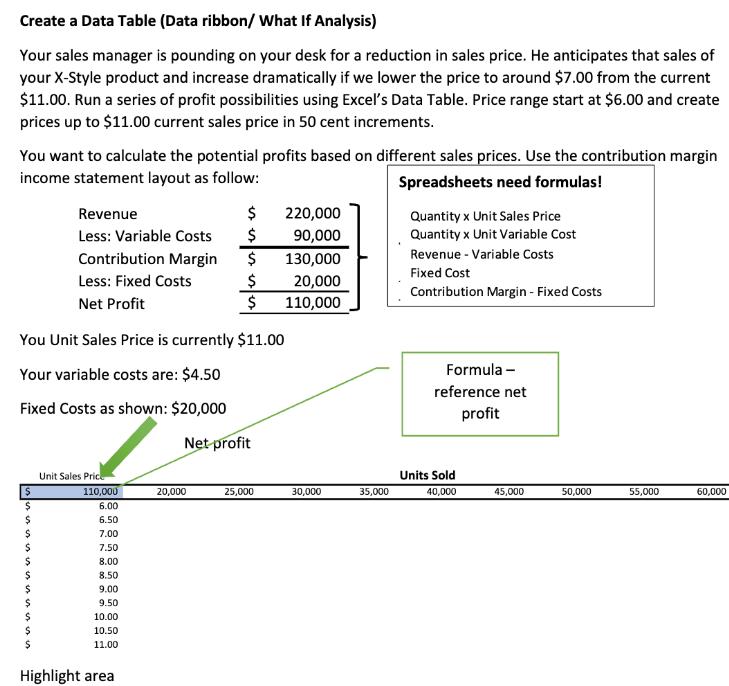
Create a Data Table (Data ribbon/ What If Analysis) Your sales manager is pounding on your desk for a reduction in sales price. He

Create a Data Table (Data ribbon/ What If Analysis) Your sales manager is pounding on your desk for a reduction in sales price. He anticipates that sales of your X-Style product and increase dramatically if we lower the price to around $7.00 from the current $11.00. Run a series of profit possibilities using Excel's Data Table. Price range start at $6.00 and create prices up to $11.00 current sales price in 50 cent increments. You want to calculate the potential profits based on different sales prices. Use the contribution margin income statement layout as follow: Spreadsheets need formulas! Quantity x Unit Sales Price Revenue $ 220,000 Less: Variable Costs $ 90,000 Quantity x Unit Variable Cost Contribution Margin $ 130,000 Fixed Cost Less: Fixed Costs $ 20,000 Revenue Variable Costs Contribution Margin - Fixed Costs Net Profit $ 110,000 You Unit Sales Price is currently $11.00 Your variable costs are: $4.50 Fixed Costs as shown: $20,000 Net profit Formula- reference net profit Unit Sales Pric Units Sold $ 110,000 20,000 25,000 30,000 35,000 40,000 45,000 50,000 55,000 60,000 ssssssssssss $ $ 6.00 6.50 $ 7.00 $ 7.50 $ 8.00 8.50 9.00 $ 9.50 10.00 10.50 11.00 Highlight area
Step by Step Solution
★★★★★
3.51 Rating (158 Votes )
There are 3 Steps involved in it
Step: 1
1 Setting Up the Spreadsheet Column A Label this column Unit Sales Price Column B List the different sales prices you want to analyze In this case sta...
Get Instant Access to Expert-Tailored Solutions
See step-by-step solutions with expert insights and AI powered tools for academic success
Step: 2

Step: 3

Ace Your Homework with AI
Get the answers you need in no time with our AI-driven, step-by-step assistance
Get Started


