example of whats needed.
One needed
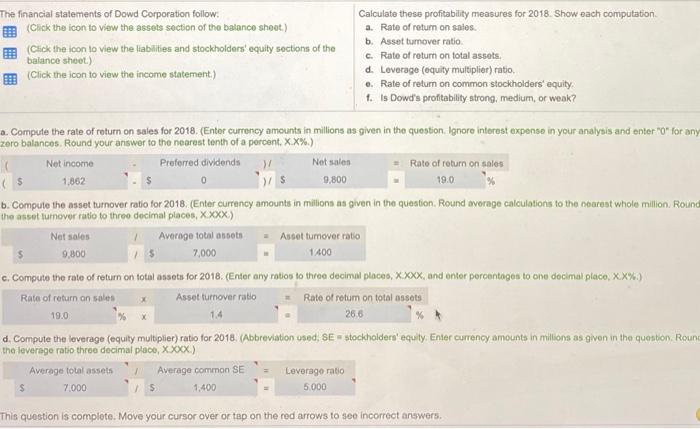
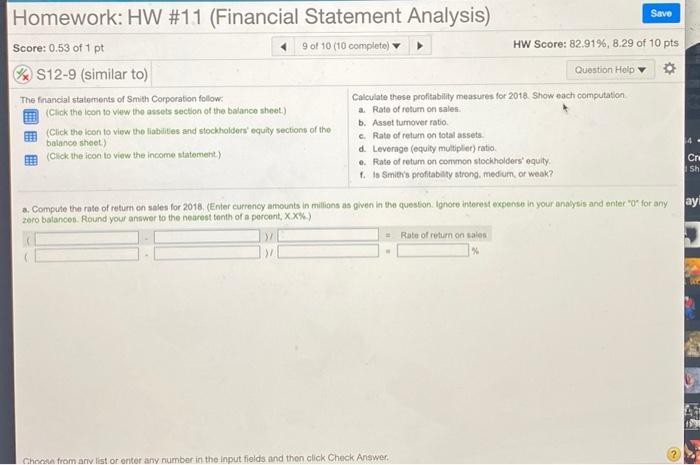
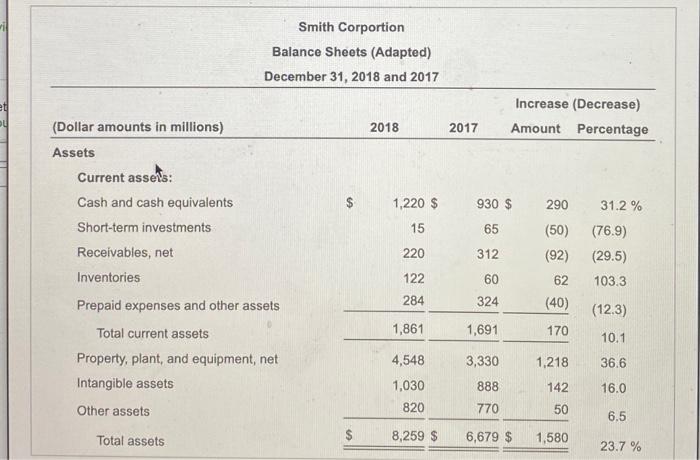
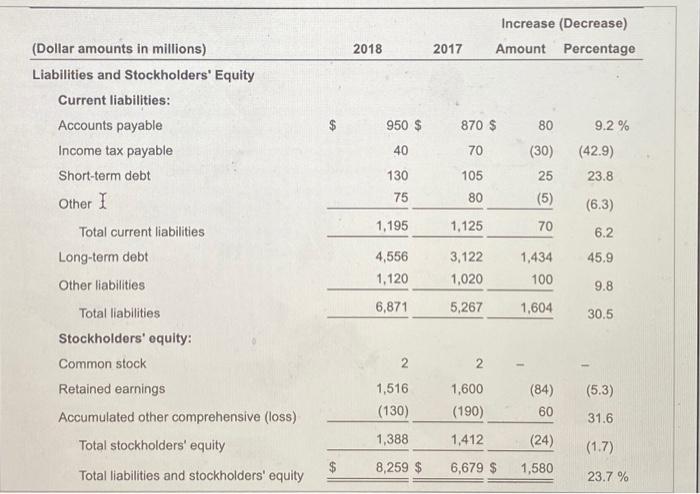
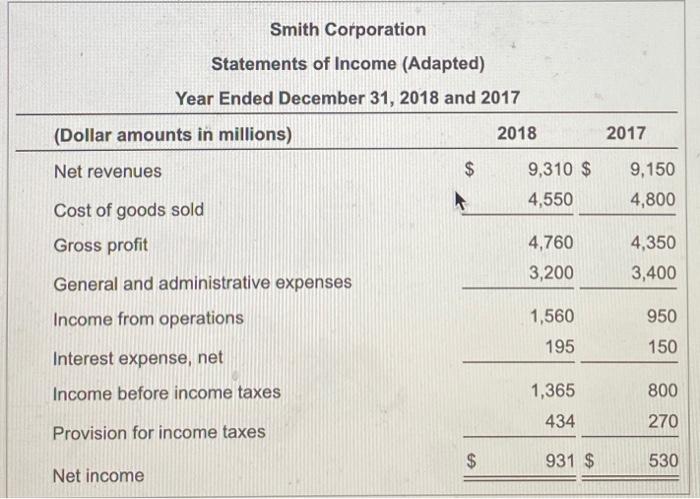
The financial statements of Dowd Corporation follow: Click the icon to view the assets section of the balance shoot.) (Click the icon to view the liabilities and stockholders' equity sections of the balance sheet.) (Click the icon to view the income statement) Calculate these profitability measures for 2018. Show each computation a. Rate of return on sales b. Asset turnover ratio C. Rate of return on total assets. d. Leverage (equity multiplier) ratio, e. Rate of return on common stockholders' equity t. Is Dowd's profitability strong, medium, or weak? Net sales a. Compute the rate of return on sales for 2018. (Enter currency amounts in millions as given in the question Ignore interest expense in your analysis and enterTo" for any zero balances. Round your answer to the nearest tenth of a percent. XX%) Net income Preferred dividends > Net sales Rate of return on sales ($ 1.862 0 $ 9,800 19.0 b. Compute the asset turnover ratio for 2018. (Enter currency amounts in millonn an given in the question. Round avorage calculations to the nearest whole million Round the asset tumover ratio to threo decimal places, XXXX) Average totalt Ascot tumover ratio 9,800 7,000 1400 c. Compute the rate of return on total assets for 2018. (Enter any ratios to three decimal places, X.XXX, und enter porcentages to one decimal place, XX%) Rate of return on sales Asset turnover ratio + Rate of rotum on total assets 19.0 26.6 d. Compute the leverage (equity multiplier) ratio for 2018. (Abbreviation used, SE - stockholders' equity, Enter currency amounts in milions as given in the question. Round the leverage ratio three decimal place, Xxxx) Average total assets Average common SE Leverage ratio 1.4 $ 7.000 15 1,400 5.000 This question is complete. Move your cursor over or tap on the red arrows to see incorrect answers Save Homework: HW #11 (Financial Statement Analysis) Score: 0.53 of 1 pt 9 of 10 (10 completo) HW Score: 82.91%, 8.29 of 10 pts S12-9 (similar to) Question Help The financial statements of Smith Corporation follow Calculate these profitability measures for 2018. Show each computation (Click the icon to vw the assets section of the balance sheet) a. Rate of return on sales b. Asset turnover ratio (Click the icon to view the liabilities and stockholders' equity sections of the balance sheet.) c. Rate of return on total assets (Click the icon to view the income statement) d. Leverage (equity multiplier) ratio e Rate of return on common stockholders' equity, 1. Smith's profitability strong, medium or weak? Cro sh ay a. Compute the rate of return on sales for 2018. (Enter currency amounts in millions de given in the question. Ignore interest expenso in your analysis and enter "o" for any zero balancon. Round your answer to the nearest tonth of a percent, XX%) Rate of return on sales 2 Chem from any list or enter any number in the input fields and then click Check Answer i Smith Corportion Balance Sheets (Adapted) December 31, 2018 and 2017 et Increase (Decrease) Amount Percentage 2018 2017 (Dollar amounts in millions) Assets Current assets: Cash and cash equivalents Short-term investments Receivables, net Inventories CA 930 $ 290 31.2 % 65 1,220 $ 15 220 122 284 (50) (92) 312 (76.9) (29.5) 103.3 62 60 324 Prepaid expenses and other assets (40) (12.3) Total current assets 1,861 1,691 170 10.1 4,548 3,330 1,218 36.6 Property, plant, and equipment, net Intangible assets 142 16.0 1,030 820 888 770 Other assets 50 6.5 Total assets $ 8,259 $ 6,679 $ 1,580 23.7 % Increase (Decrease) Amount Percentage 2018 2017 (Dollar amounts in millions) Liabilities and Stockholders' Equity Current liabilities: Accounts payable Income tax payable Short-term debt 950 $ 870 $ 80 9.2 % 40 130 75 70 105 80 (30) 25 (5) (42.9) 23.8 Other I (6.3) Total current liabilities 1,195 1,125 70 6.2 Long-term debt 45.9 4,556 1,120 3,122 1,020 1,434 100 Other liabilities 9.8 6,871 5,267 1,604 30.5 2 Total liabilities Stockholders' equity: Common stock Retained earnings Accumulated other comprehensive (loss) Total stockholders' equity (5.3) 1,516 (130) 1,600 (190) (84) 60 31.6 1,388 1,412 (24) (1.7) $ 8,259 $ Total liabilities and stockholders' equity 6,679 $ 1,580 23.7 % Smith Corporation Statements of Income (Adapted) Year Ended December 31, 2018 and 2017 (Dollar amounts in millions) 2018 2017 Net revenues 9,310 $ 4,550 9,150 4,800 Cost of goods sold Gross profit General and administrative expenses Income from operations 4,760 3,200 4,350 3,400 1,560 950 195 150 Interest expense, net Income before income taxes 1,365 800 434 270 Provision for income taxes $ 931 $ 530 Net income