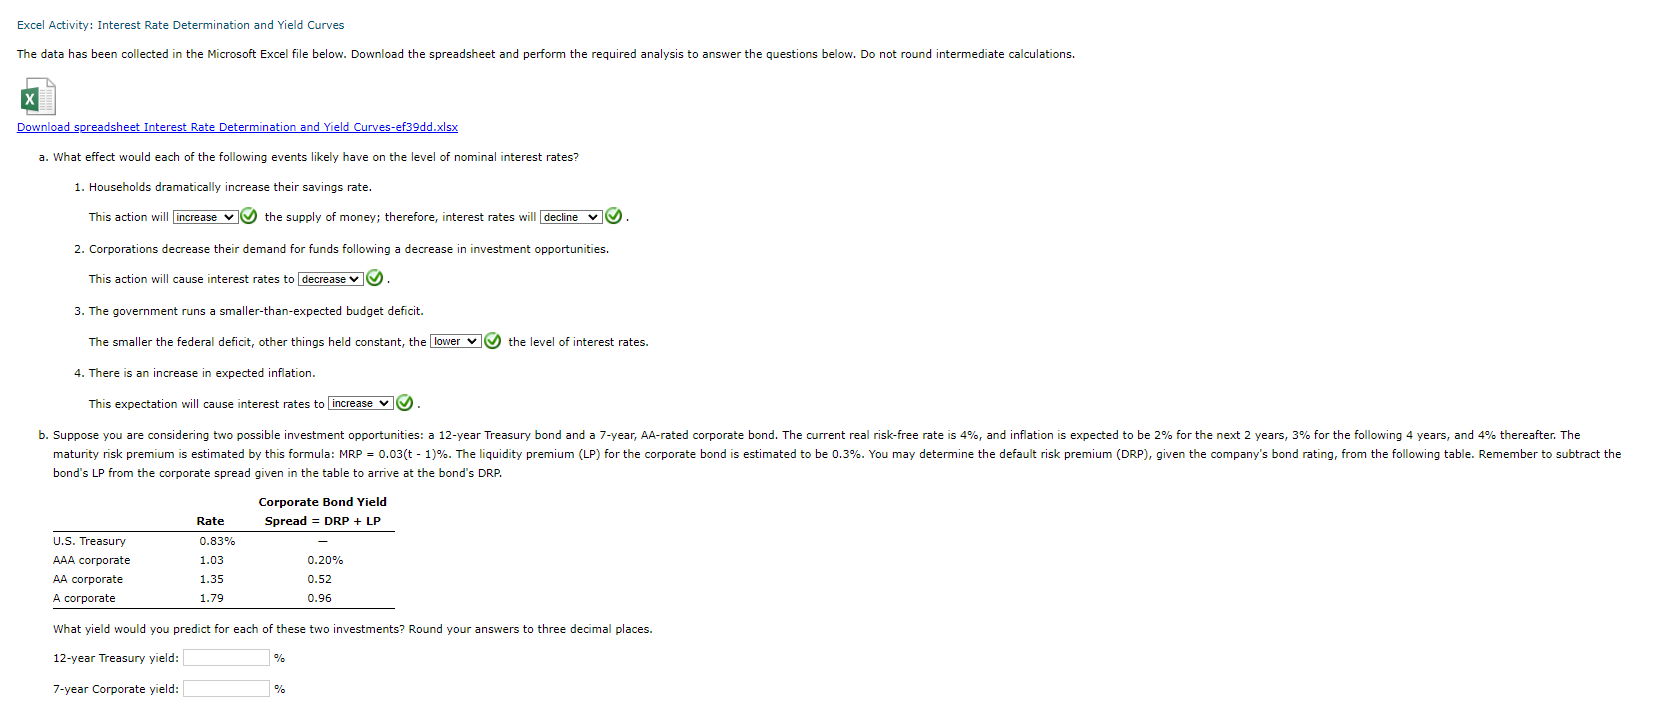
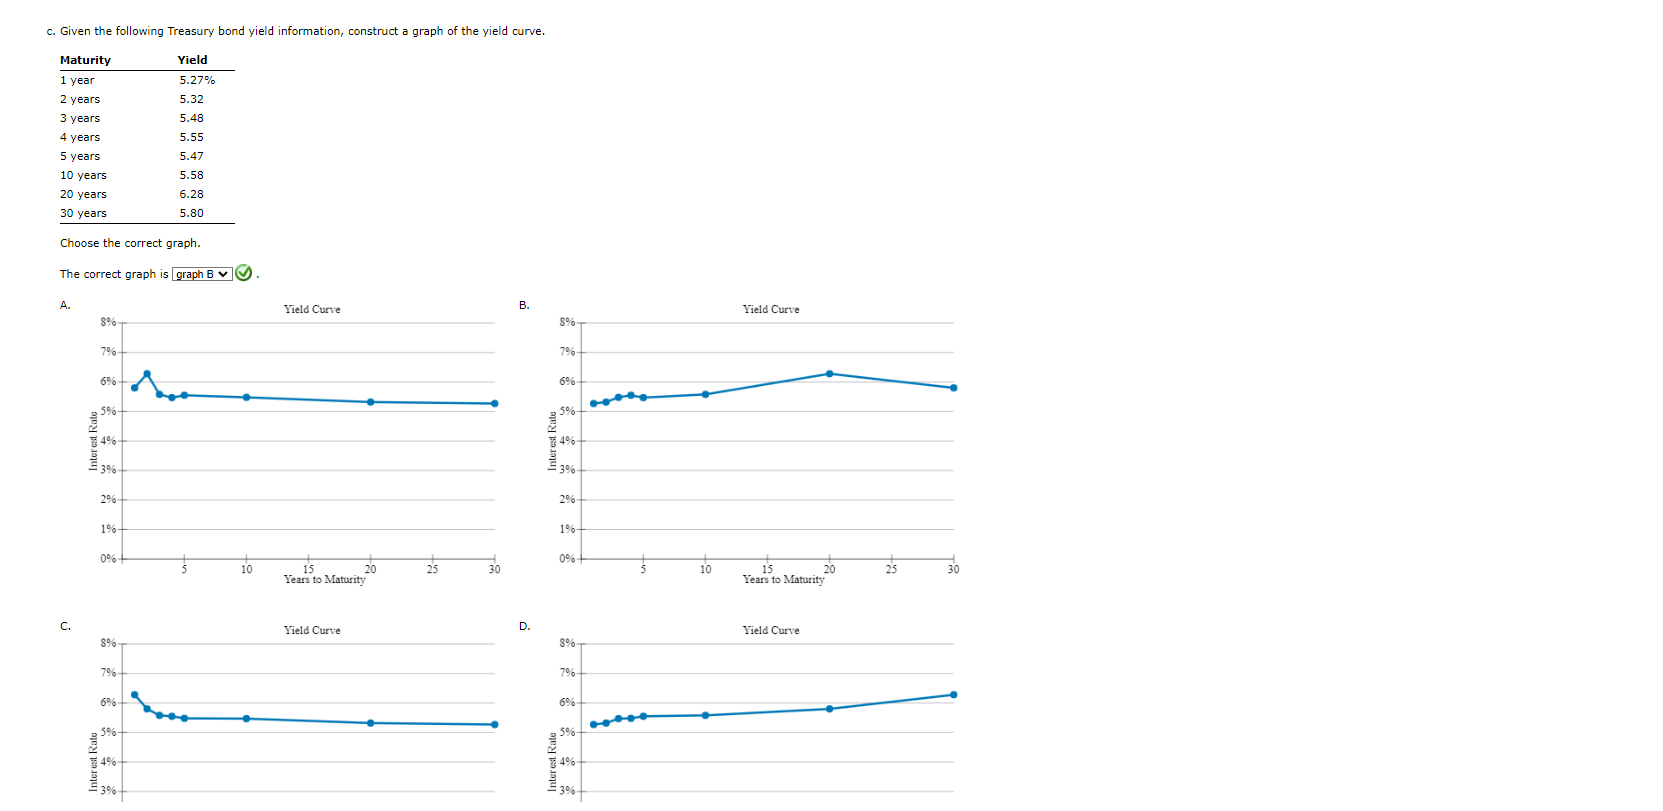
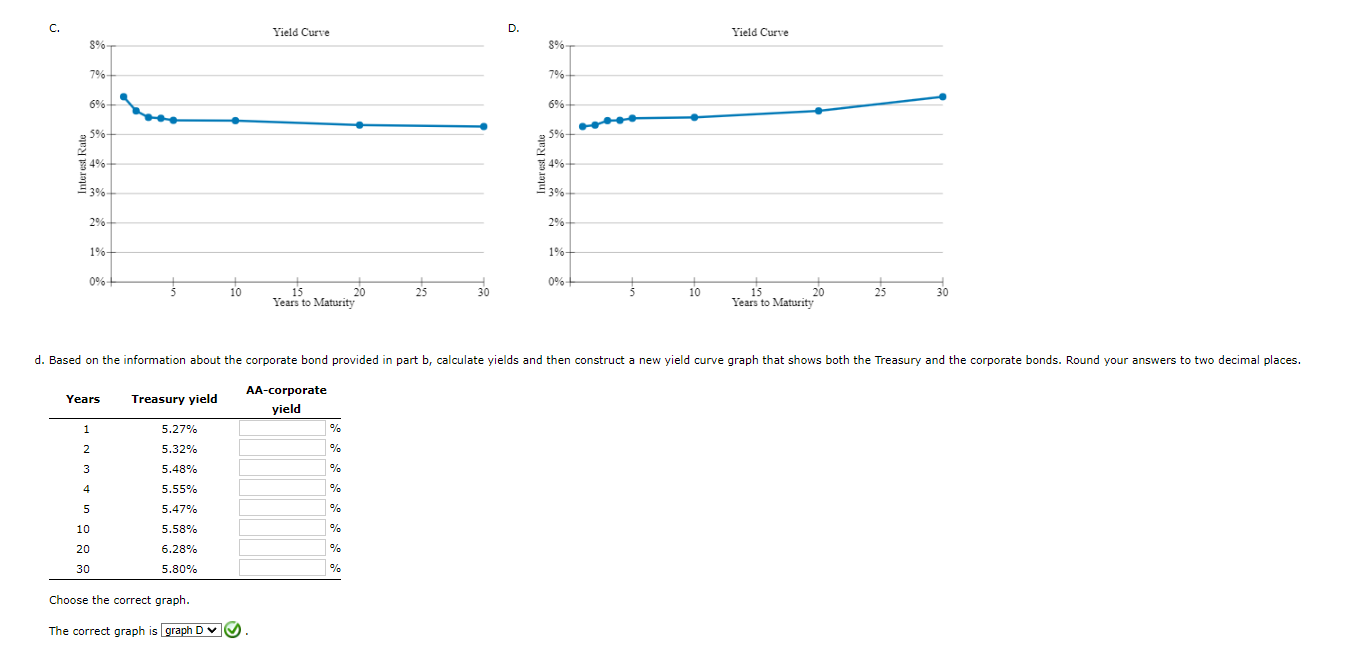
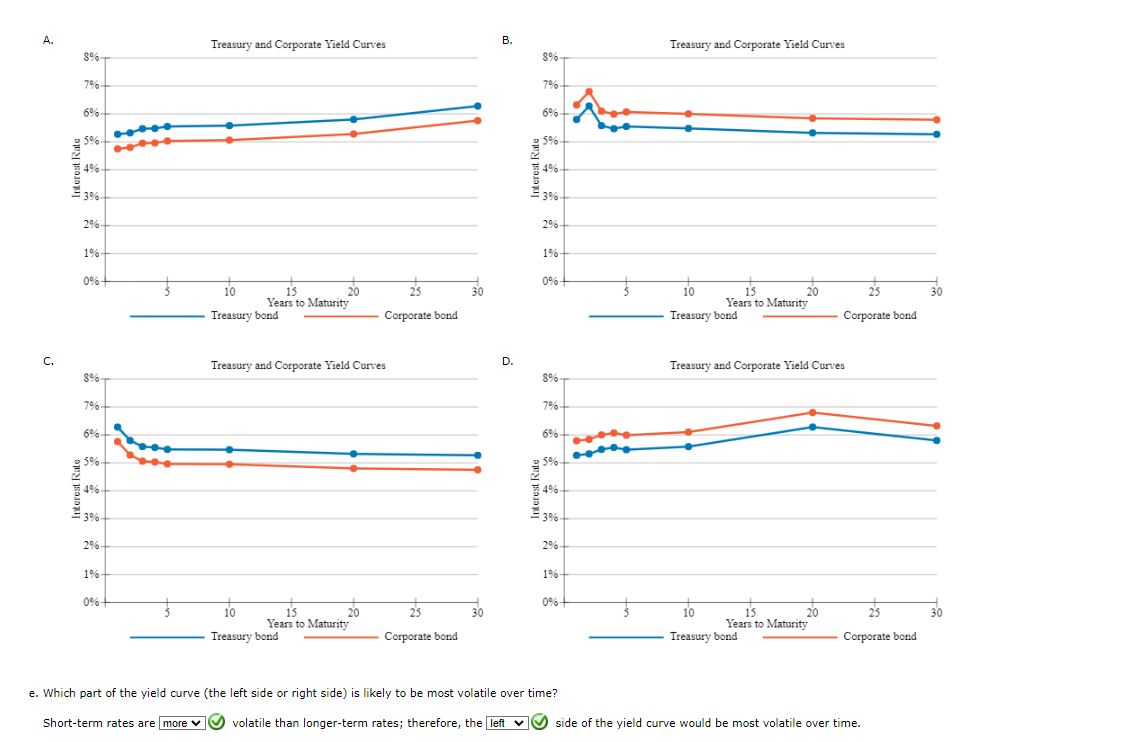
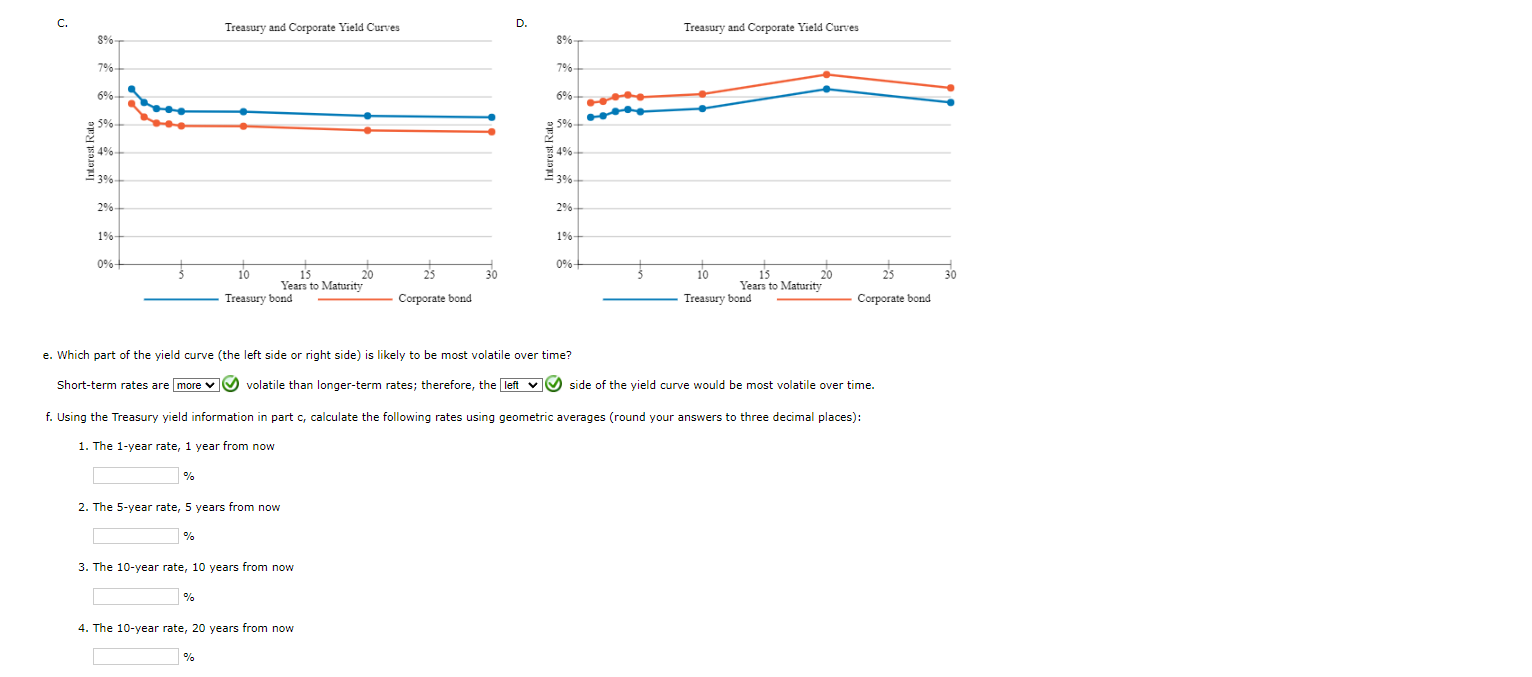
Excel Activity: Interest Rate Determination and Yield Curves Download spreadsheet Interest Rate Determination and Yield Curves-ef39dd.xlsx a. What effect would each of the following events likely have on the level of nominal interest rates? 1. Households dramatically increase their savings rate. This action will (he supply of money; therefore, interest rates will decline v. 2. Corporations decrease their demand for funds following a decrease in investment opportunities. This action will cause interest rates to decrease v. 3. The government runs a smaller-than-expected budget deficit. The smaller the federal deficit, other things held constant, the lower v the level of interest rates. 4. There is an increase in expected inflation. This expectation will cause interest rates to increase v. bond's LP from the corporate spread given in the table to arrive at the bond's DRP. What yield would you predict for each of these two investments? Round your answers to three decimal places. 12-year Treasury yield: 7-year Corporate yield: c. Given the following Treasury bond yield information, construct a graph of the yield curve. Choose the correct graph. The correct graph is graph B . . Choose the correct graph. The correct graph is e. Which part of the yield curve (the left side or right side) is likely to be most volatile over time? Short-term rates are volatile than longer-term rates; therefore, the side of the yield curve would be most volatile over time. e. Which part of the yield curve (the left side or right side) is likely to be most volatile over time? Short-term rates are more v volatile than longer-term rates; therefore, the left v side of the yield curve would be most volatile over time. f. Using the Treasury yield information in part c, calculate the following rates using geometric averages (round your answers to three decimal places): 1. The 1-year rate, 1 year from now % 2. The 5 -year rate, 5 years from now % 3. The 10 -year rate, 10 years from now % 4. The 10 -year rate, 20 years from now % Excel Activity: Interest Rate Determination and Yield Curves Download spreadsheet Interest Rate Determination and Yield Curves-ef39dd.xlsx a. What effect would each of the following events likely have on the level of nominal interest rates? 1. Households dramatically increase their savings rate. This action will (he supply of money; therefore, interest rates will decline v. 2. Corporations decrease their demand for funds following a decrease in investment opportunities. This action will cause interest rates to decrease v. 3. The government runs a smaller-than-expected budget deficit. The smaller the federal deficit, other things held constant, the lower v the level of interest rates. 4. There is an increase in expected inflation. This expectation will cause interest rates to increase v. bond's LP from the corporate spread given in the table to arrive at the bond's DRP. What yield would you predict for each of these two investments? Round your answers to three decimal places. 12-year Treasury yield: 7-year Corporate yield: c. Given the following Treasury bond yield information, construct a graph of the yield curve. Choose the correct graph. The correct graph is graph B . . Choose the correct graph. The correct graph is e. Which part of the yield curve (the left side or right side) is likely to be most volatile over time? Short-term rates are volatile than longer-term rates; therefore, the side of the yield curve would be most volatile over time. e. Which part of the yield curve (the left side or right side) is likely to be most volatile over time? Short-term rates are more v volatile than longer-term rates; therefore, the left v side of the yield curve would be most volatile over time. f. Using the Treasury yield information in part c, calculate the following rates using geometric averages (round your answers to three decimal places): 1. The 1-year rate, 1 year from now % 2. The 5 -year rate, 5 years from now % 3. The 10 -year rate, 10 years from now % 4. The 10 -year rate, 20 years from now %


