

Answered step by step
Verified Expert Solution
Question
1 Approved Answer
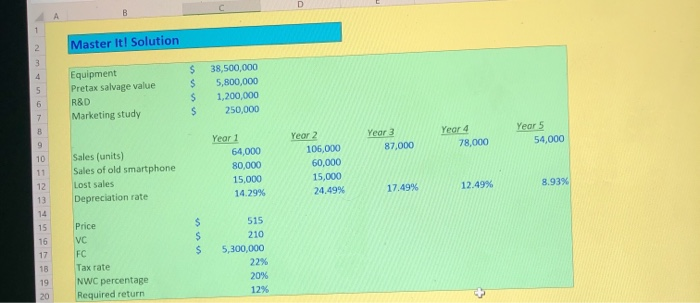
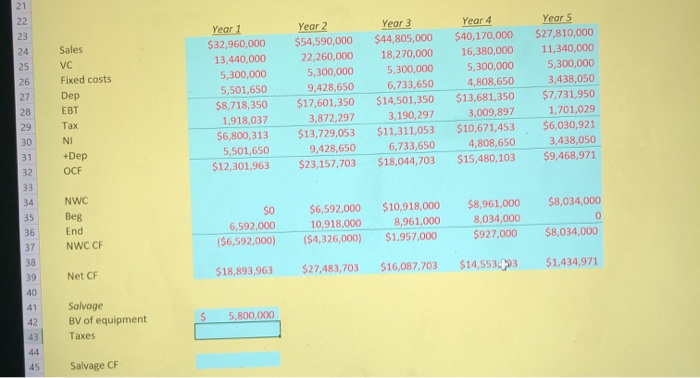
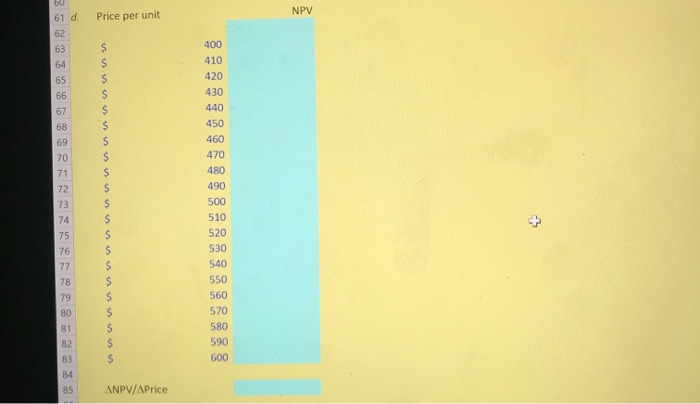
Excel (Formula) 41 D 1 2 Chapter 9 - Master It! 3 For this Master itl assignment, refer to the Conch Republic Electronics Case at
Excel (Formula) 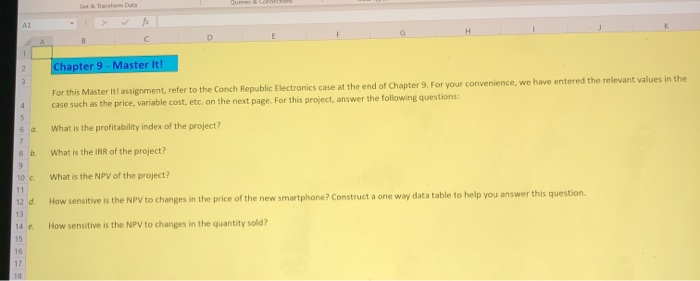


Step by Step Solution
There are 3 Steps involved in it
Step: 1

Get Instant Access to Expert-Tailored Solutions
See step-by-step solutions with expert insights and AI powered tools for academic success
Step: 2

Step: 3
Ace Your Homework with AI
Get the answers you need in no time with our AI-driven, step-by-step assistance
Get Started
Winning Your Audit Prepare Diligently Be Realistic Then Stand Your Ground
Authors: Holmes F. Crouch
2nd Edition
0944817319, 978-0944817315