

Answered step by step
Verified Expert Solution
Question
1 Approved Answer
Excel Online Structured Activity: Evaluating Risk and Return Bartman Industries's and Reynolds Inc.'s stock prices and dividends, along with the Winslow 5000 Index, are shown
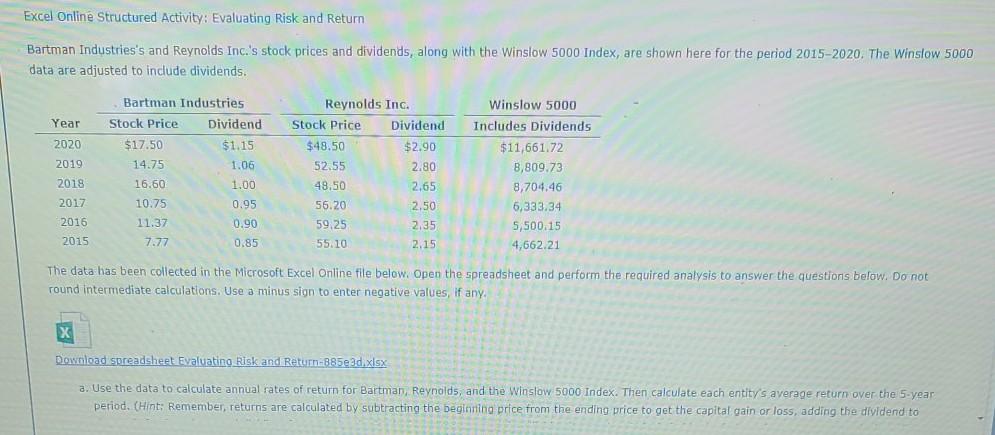
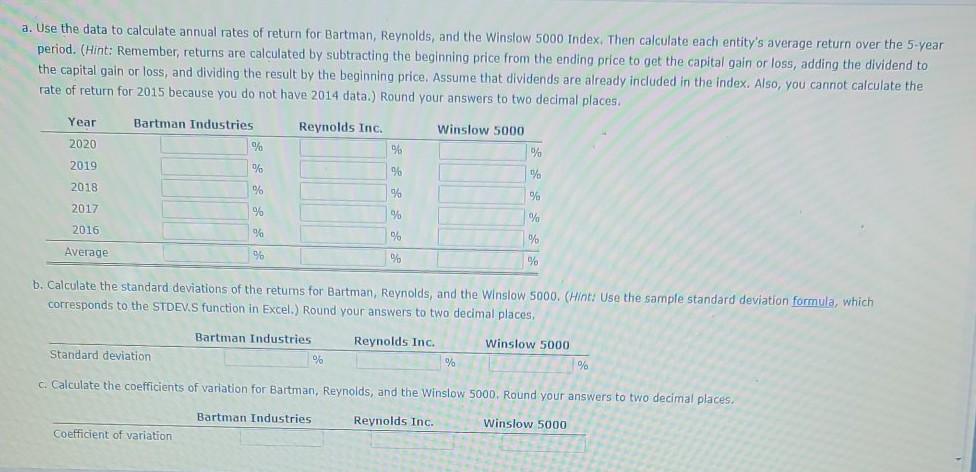
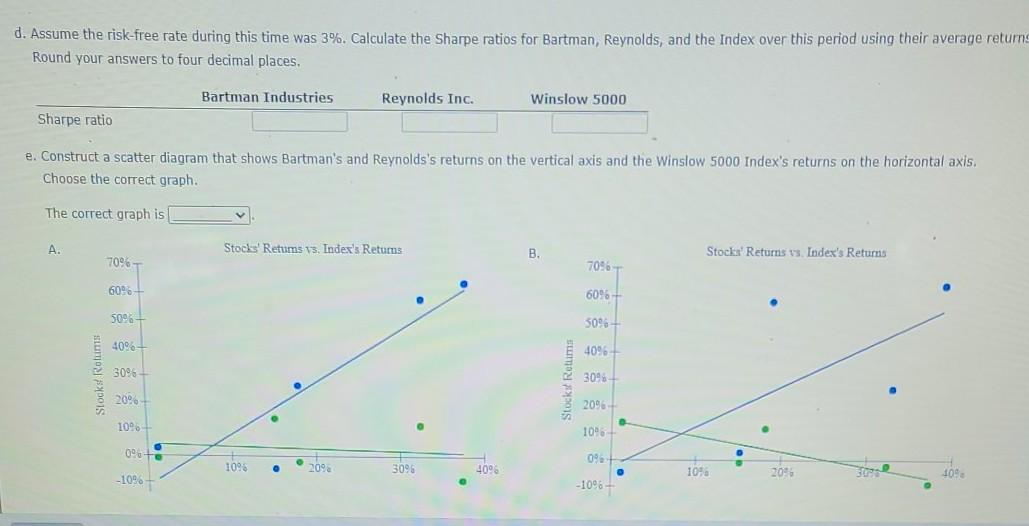
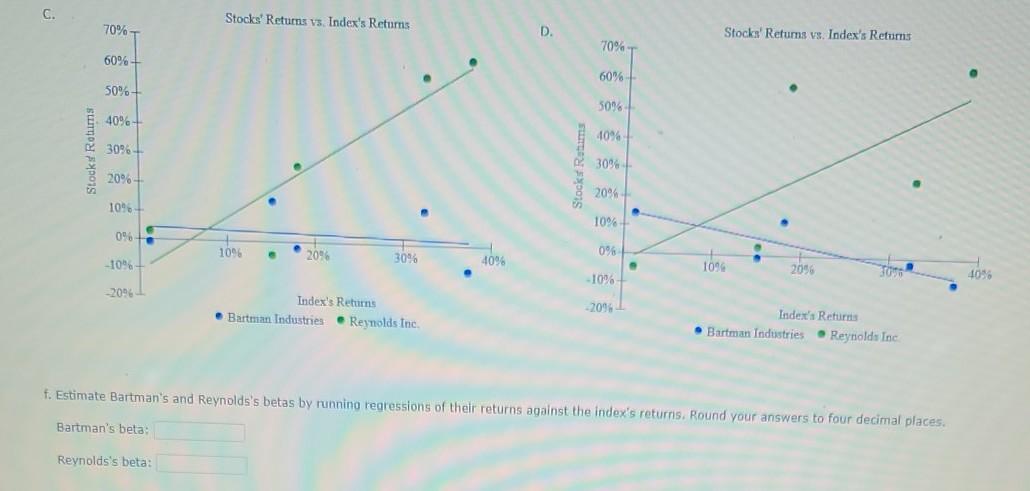
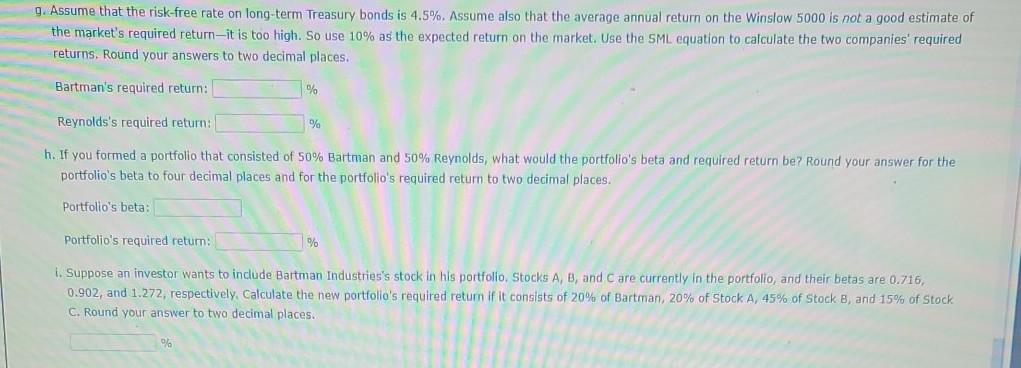
Excel Online Structured Activity: Evaluating Risk and Return Bartman Industries's and Reynolds Inc.'s stock prices and dividends, along with the Winslow 5000 Index, are shown here for the period 2015-2020. The Winslow 5000 data are adjusted to include dividends. Bartman Industries Reynolds Inc. Winslow 5000 Year Stock Price Dividend Stock Price Dividend Includes Dividends 2020 $17.50 $1.15 $48.50 $2.90 $11,661.72 2019 14.75 1.06 52.55 2.80 8,809.73 2018 16.60 1.00 49.50 2.65 8,704.46 2017 10.75 0.95 56.20 2.50 6,333.34 2016 11.37 0.90 59.25 2.35 5,500.15 2015 7.77 0.85 55.10 2.15 4,662.21 The data has been collected in the Microsoft Excel Online file below. Open the spreadsheet and perform the required analysis to answer the questions below. Do not round intermediate calculations. Use a minus sign to enter negative values, if any. X Download spreadsheet Evaluating Risk and Return:885e3d xlsx a. Use the data to calculate annual rates of return for Bartman, Reynolds, and the Winslow 5000 Index. Then calculate each entity's average return over the 5-year period. (Hint: Remember returns are calculated by subtracting the beginning price from the ending price to get the capital gain or loss, adding the dividend to a. Use the data to calculate annual rates of return for Bartman, Reynolds, and the Winslow 5000 Index. Then calculate each entity's average return over the 5-year period. (Hint: Remember, returns are calculated by subtracting the beginning price from the ending price to get the capital gain or loss, adding the dividend to the capital gain or loss, and dividing the result by the beginning price. Assume that dividends are already included in the index. Also, you cannot calculate the rate of return for 2015 because you do not have 2014 data.) Round your answers to two decimal places. Year Bartman Industries Reynolds Inc Winslow 5000 2020 % % % 2019 % 96 % 2018 % % % 2017 % % % 2016 % % % Average 96 9% % b. Calculate the standard deviations of the retums for Bartman, Reynolds, and the Winslow 5000. (Hint: Use the sample standard deviation formula, which corresponds to the STDEV.S function in Excel.) Round your answers to two decimal places, Bartman Industries Reynolds Inc. Winslow 5000 Standard deviation % % % c. Calculate the coefficients of variation for Batman, Reynolds, and the Winslow 5000. Round your answers to two decimal places. Bartman Industries Reynolds Inc. Winslow 5000 Coefficient of variation d. Assume the risk-free rate during this time was 3%. Calculate the Sharpe ratios for Bartman, Reynolds, and the Index over this period using their average returns Round your answers to four decimal places. Bartman Industries Reynolds Inc. Winslow 5000 Sharpe ratio e. Construct a scatter diagram that shows Bartman's and Reynolds's returns on the vertical axis and the Winslow 5000 Index's returns on the horizontal axis. Choose the correct graph. The correct graph is A Stocks' Retums vs. Index's Retums B. Stocks' Returns vs. Index's Returns 70% 7096 6006 60% 5096 306 40% 4096 Stocks Rotis 3096 Stock Retums 3096 20% 2096 10% 1096 0+ 10% 096+ 109 3096 4096 1046 209 109 -10%- -10- C. Stocks' Returns vs. Index's Returns 70% D. Stocks' Returns vs. Index's Returns 70% 60% 60% 50% 509 40%+ 40% Stock Rom 30% Stock Rom 3094-1 20% 2096 10% 10% 0% 1096 - 2096 0% 30% -109 4096 10% 2096 -10% 4096 -2096 Index's Returns Bartman Industries Reynolds Inc. -20% Index's Returns Bartman Industries Reynolds Inc f. Estimate Bartman's and Reynolds's betas by running regressions of their returns against the index's returris. Round your answers to four decimal places. Bartman's beta Reynolds's beta: 9. Assume that the risk-free rate on long-term Treasury bonds is 4.5%. Assume also that the average annual return on the Winslow 5000 is not a good estimate of the market's required return-it is too high. So use 10% as the expected return on the market. Use the SML equation to calculate the two companies' required returns. Round your answers to two decimal places. Bartman's required return; % Reynolds's required return: % h. If you formed a portfolio that consisted of 50% Bartman and 50% Reynolds, what would the portfolio's beta and required return be? Round your answer for the portfolio's beta to four decimal places and for the portfolio's required return to two decimal places. Portfolio's beta Portfolio's required retur: 96 1. Suppose an investor wants to include Bartman Industries's stock in his portfolio Stocks A, B, and care currently in the portfolio, and their betas are 0.716, 0.902, and 1.272, respectively. Calculate the new portfolio's required retum if it consists of 20% of Bartman, 20% of Stock A, 45% of Stock B, and 15% of Stock C. Round your answer to two decimal places
Step by Step Solution
There are 3 Steps involved in it
Step: 1

Get Instant Access to Expert-Tailored Solutions
See step-by-step solutions with expert insights and AI powered tools for academic success
Step: 2

Step: 3
Ace Your Homework with AI
Get the answers you need in no time with our AI-driven, step-by-step assistance
Get Started
Financial Systems In Troubled Waters Information Strategies And Governance To Enhance Performances In Risky Times
Authors: Alessandro Carretta , Gianluca Mattarocci
1st Edition
0415628792, 978-0415628792