Answered step by step
Verified Expert Solution
Question
1 Approved Answer
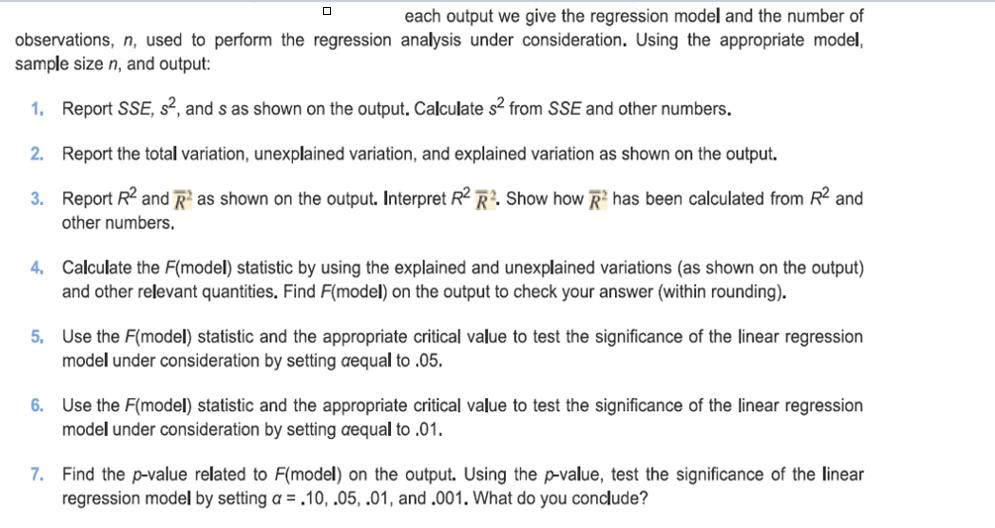
each output we give the regression model and the number of observations, n, used to perform the regression analysis under consideration. Using the appropriate


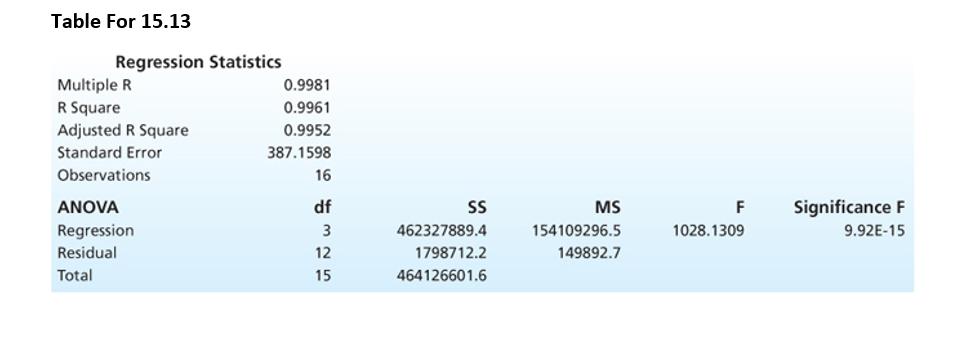
each output we give the regression model and the number of observations, n, used to perform the regression analysis under consideration. Using the appropriate model, sample size n, and output: 1. Report SSE, s, and s as shown on the output. Calculate s from SSE and other numbers. 2. Report the total variation, unexplained variation, and explained variation as shown on the output. 3. Report R and as shown on the output. Interpret R R. Show how R2 has been calculated from R and other numbers. 4. Calculate the F(model) statistic by using the explained and unexplained variations (as shown on the output) and other relevant quantities. Find F(model) on the output to check your answer (within rounding). 5. Use the F(model) statistic and the appropriate critical value to test the significance of the linear regression model under consideration by setting aequal to .05. 6. Use the F(model) statistic and the appropriate critical value to test the significance of the linear regression model under consideration by setting aequal to .01. 7. Find the p-value related to F(model) on the output. Using the p-value, test the significance of the linear regression model by setting a = .10, .05, .01, and .001. What do you conclude? Table For 15.13 Regression Statistics Multiple R R Square Adjusted R Square Standard Error Observations ANOVA Regression Residual Total 0.9981 0.9961 0.9952 387.1598 16 df 5325 12 15 SS 462327889.4 1798712.2 464126601.6 MS 154109296.5 149892.7 F 1028.1309 Significance F 9.92E-15
Step by Step Solution
★★★★★
3.49 Rating (156 Votes )
There are 3 Steps involved in it
Step: 1
Hello Sir i ...
Get Instant Access to Expert-Tailored Solutions
See step-by-step solutions with expert insights and AI powered tools for academic success
Step: 2

Step: 3

Ace Your Homework with AI
Get the answers you need in no time with our AI-driven, step-by-step assistance
Get Started


