Exercise 1 part 2 question 4: Analyze and comment on the computations performed in exercise 1 part 1. Compare and comment on the results between stocks and compare the results in 2019 and 2020. How could you explain the main changes in the results between 2019 and 2020 (if any)? The most precise your answer is, the better it is.
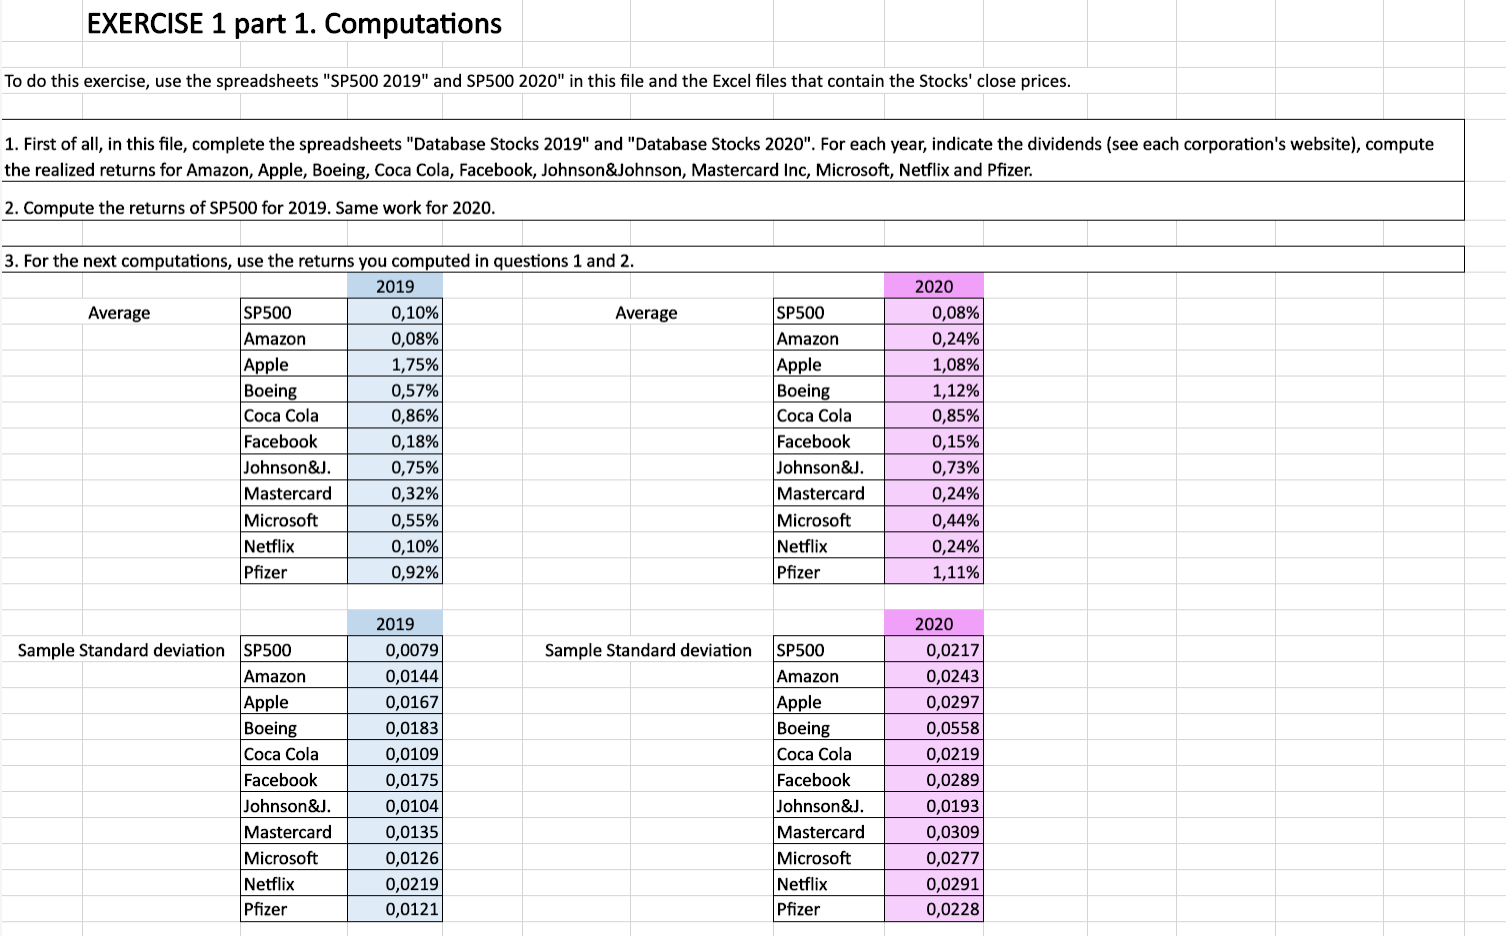
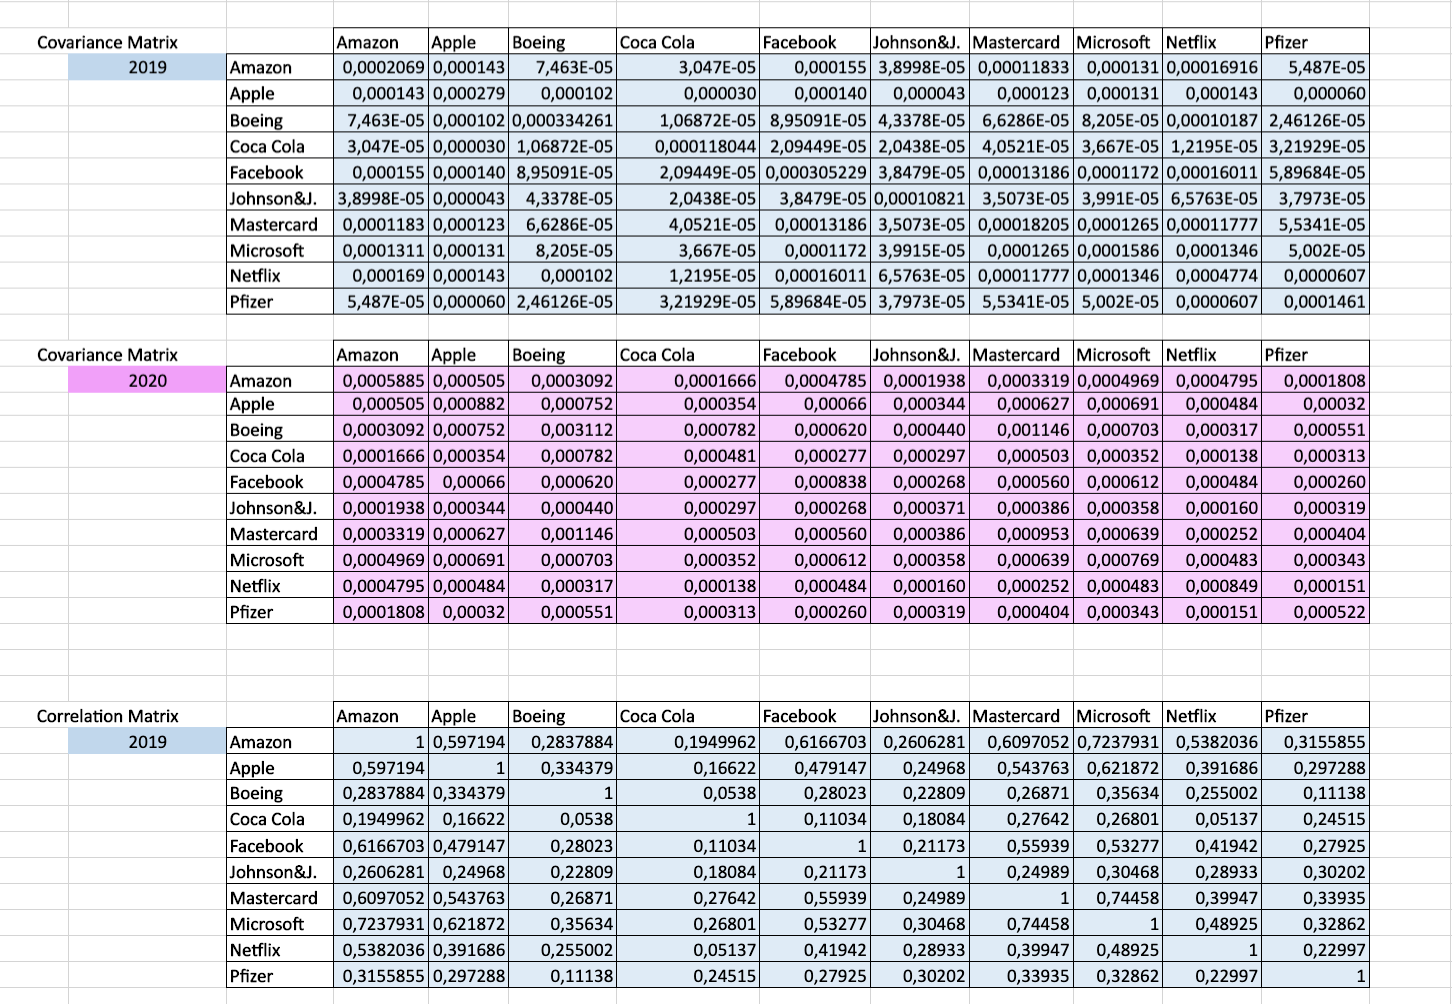
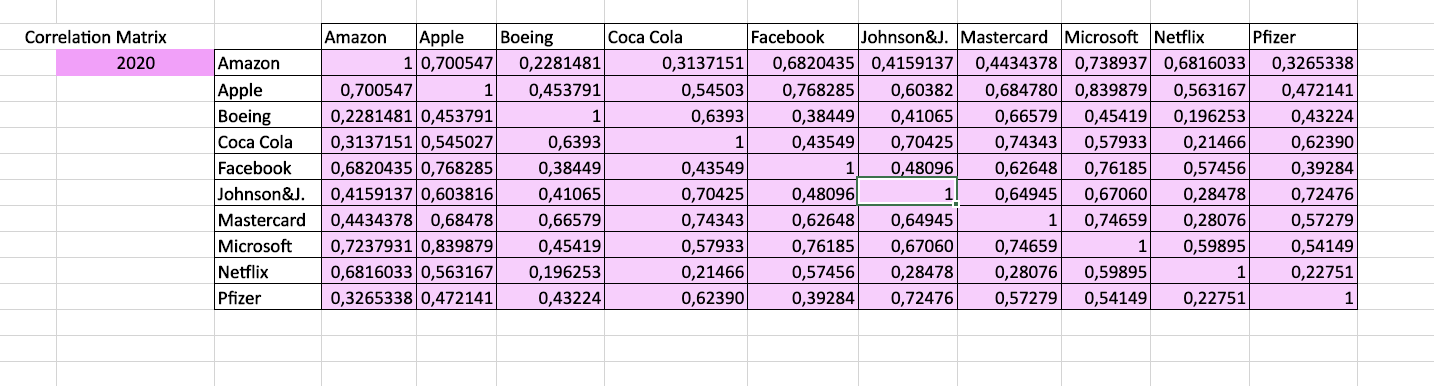
EXERCISE 1 part 2. Analysis To answer this question, use the computations from Exercise 1 part 1. 4. Analyse and comment on the computations performed in Exercise 1 part 1. Compare and comment on the results between stocks and compare the results in 2019 and 2020. How could you explain main changes in the results between 2019 and 2020 (if any)? The more precise your answer is, the better it is. Answer below. EXERCISE 1 part 1. Computations To do this exercise, use the spreadsheets "SP500 2019" and SP500 2020" in this file and the Excel files that contain the Stocks' close prices. 1. First of all, in this file, complete the spreadsheets "Database Stocks 2019" and "Database Stocks 2020". For each year, indicate the dividends (see each corporation's website), compute the realized returns for Amazon, Apple, Boeing, Coca Cola, Facebook, Johnson&Johnson, Mastercard Inc, Microsoft, Netflix and Pfizer. 2. Compute the returns of SP500 for 2019. Same work for 2020. 3. For the next computations, use the returns you computed in questions 1 and 2. 2019 Average SP500 0,10% Average Amazon 0,08% Apple 1,75% Boeing 0,57% Coca Cola 0,86% Facebook 0,18% Johnson&J. 0,75% Mastercard 0,32% Microsoft 0,55% Netflix 0,10% Pfizer 0,92% SP500 Amazon Apple Boeing Coca Cola Facebook Johnson&J. Mastercard Microsoft Netflix Pfizer 2020 0,08% 0,24% 1,08% 1,12% 0,85% 0,15% 0,73% 0,24% 0,44% 0,24% 1,11% 2020 Sample Standard deviation Sample Standard deviation SP500 Amazon Apple Boeing Coca Cola Facebook Johnson&J. Mastercard Microsoft Netflix Pfizer 2019 0,0079 0,0144 0,0167 0,0183 0,0109 0,0175 0,0104 0,0135 0,0126 0,0219 0,0121 SP500 Amazon Apple Boeing Coca Cola Facebook Johnson&J. Mastercard Microsoft Netflix Pfizer 0,0217 0,0243 0,0297 0,0558 0,0219 0,0289 0,0193 0,0309 0,0277 0,0291 0,0228 Covariance Matrix 2019 Amazon Apple Boeing Coca Cola Facebook Johnson&J. Mastercard Microsoft Netflix Pfizer Amazon Apple Boeing Coca Cola Facebook Johnson&J. Mastercard Microsoft Netflix Pfizer 0,0002069 0,000143 7,463E-05 3,047E-05 0,000155 3,8998E-05 0,00011833 0,000131 0,00016916 5,487E-05 0,000143 0,000279 0,000102 0,000030 0,000140 0,000043 0,000123 0,000131 0,000143 0,000060 7,463E-05 0,000102 0,000334261 1,06872E-05 8,95091E-05 4,3378E-05 6,6286E-05 8,205E-05 0,00010187 2,46126E-05 3,047E-05 0,000030 1,06872E-05 0,000118044 2,09449E-05 2,0438E-05 4,0521E-05 3,667E-05 1,2195E-05 3,21929E-05 0,000155 0,0001408,95091E-05 2,09449E-05 0,000305229 3,8479E-05 0,00013186 0,0001172 0,00016011 5,89684E-05 3,8998E-05 0,000043 4,3378E-05 2,0438E-05 3,8479E-05 0,00010821 3,5073E-05 3,991E-05 6,5763E-05 3,7973E-05 0,0001183 0,000123 6,6286E-05 4,0521E-05 0,00013186 3,5073E-05 0,00018205 0,0001265 0,00011777 5,5341E-05 0,0001311 0,000131 8,205E-05 3,667E-05 0,0001172 3,9915E-05 0,0001265 0,0001586 0,0001346 5,002E-05 0,000169 0,000143 0,000102 1,2195E-05 0,00016011 6,5763E-05 0,00011777 0,0001346 0,0004774 0,0000607 5,487E-05 0,000060 2,46126E-05 3,21929E-05 5,89684E-05 3,7973E-05 5,5341E-05 5,002E-05 0,0000607 0,0001461 Covariance Matrix 2020 Amazon Apple Boeing Coca Cola Facebook Johnson&J. Mastercard Microsoft Netflix Pfizer Amazon Apple Boeing Coca Cola Facebook Johnson&J. Mastercard Microsoft Netflix Pfizer 0,0005885 0,000505 0,0003092 0,0001666 0,0004785 0,0001938 0,0003319 0,0004969 0,0004795 0,0001808 0,000505 0,000882 0,000752 0,000354 0,00066 0,000344 0,000627 0,000691 0,000484 0,00032 0,0003092 0,000752 0,003112 0,000782 0,000620 0,000440 0,001146 0,000703 0,000317 0,000551 0,0001666 0,000354 0,000782 0,000481 0,000277 0,000297 0,000503 0,000352 0,000138 0,000313 0,0004785 0,00066 0,000620 0,000277 0,000838 0,000268 0,000560 0,000612 0,000484 0,000260 0,0001938 0,000344 0,000440 0,000297 0,000268 0,000371 0,000386 0,000358 0,000160 0,000319 0,0003319 0,000627 0,001146 0,000503 0,000560 0,000386 0,000953 0,000639 0,000252 0,000404 0,0004969 0,000691 0,000703 0,000352 0,000612 0,000358 0,000639 0,000769 0,000483 0,000343 0,0004795 0,000484 0,000317 0,000138 0,000484 0,000160 0,000252 0,000483 0,000849 0,000151 0,0001808 0,00032 0,000551 0,000313 0,000260 0,000319 0,000404 0,000343 0,000151 0,000522 Pfizer Correlation Matrix 2019 Amazon Apple Boeing Coca Cola Facebook Johnson&J. Mastercard Microsoft Netflix Pfizer Amazon Apple Boeing Coca Cola Facebook Johnson&J. Mastercard Microsoft Netflix 1 0,597194 0,2837884 0,1949962 0,6166703 0,2606281 0,6097052 0,7237931 0,5382036 0,597194 1 0,334379 0,16622 0,479147 0,24968 0,543763 0,621872 0,391686 0,2837884 0,334379 1 0,0538 0,28023 0,22809 0,26871 0,35634 0,255002 0,1949962 0,16622 0,0538 0,11034 0,18084 0,27642 0,26801 0,05137 0,6166703 0,479147 0,28023 0,11034 1 0,21173 0,55939 0,53277 0,41942 0,2606281 0,24968 0,22809 0,18084 0,21173 1 0,24989 0,30468 0,28933 0,6097052 0,543763 0,26871 0,27642 0,55939 0,24989 1 0,74458 0,39947 0,7237931 0,621872 0,35634 0,26801 0,53277 0,30468 0,74458 1 0,48925 0,5382036 0,391686 0,255002 0,05137 0,41942 0,28933 0,39947 0,48925 1 0,3155855 0,297288 0,11138 0,24515 0,27925 0,30202 0,33935 0,32862 0,22997 0,3155855 0,297288 0,11138 0,24515 0,27925 0,30202 0,33935 0,32862 0,22997 1 Correlation Matrix 2020 Amazon Apple Boeing Coca Cola Facebook Johnson&J. Mastercard Microsoft Netflix Pfizer Amazon Apple Boeing Coca Cola Facebook Johnson&J. Mastercard Microsoft Netflix Pfizer 1 0,700547 0,2281481 0,3137151 0,6820435 0,4159137 0,4434378 0,738937 0,6816033 0,3265338 0,700547 1 0,453791 0,54503 0,768285 0,60382 0,684780 0,839879 0,563167 0,472141 0,2281481 0,453791 1 0,6393 0,38449 0,41065 0,66579 0,45419 0,196253 0,43224 0,3137151 0,545027 0,6393 1 0,43549 0,70425 0,74343 0,57933 0,21466 0,62390 0,6820435 0,768285 0,38449 0,43549 1 0,48096 0,62648 0,76185 0,57456 0,39284 0,4159137 0,603816 0,41065 0,70425 0,48096 1 0,64945 0,67060 0,28478 0,72476 0,4434378 0,68478 0,66579 0,74343 0,62648 0,64945 1 0,74659 0,28076 0,57279 0,7237931 0,839879 0,45419 0,57933 0,76185 0,67060 0,74659 1 0,59895 0,54149 0,68160330,563167 0,196253 0,21466 0,57456 0,28478 0,28076 0,59895 0,22751 0,3265338 0,472141 0,43224 0,62390 0,39284 0,72476 0,57279 0,54149 0,22751 EXERCISE 1 part 2. Analysis To answer this question, use the computations from Exercise 1 part 1. 4. Analyse and comment on the computations performed in Exercise 1 part 1. Compare and comment on the results between stocks and compare the results in 2019 and 2020. How could you explain main changes in the results between 2019 and 2020 (if any)? The more precise your answer is, the better it is. Answer below. EXERCISE 1 part 1. Computations To do this exercise, use the spreadsheets "SP500 2019" and SP500 2020" in this file and the Excel files that contain the Stocks' close prices. 1. First of all, in this file, complete the spreadsheets "Database Stocks 2019" and "Database Stocks 2020". For each year, indicate the dividends (see each corporation's website), compute the realized returns for Amazon, Apple, Boeing, Coca Cola, Facebook, Johnson&Johnson, Mastercard Inc, Microsoft, Netflix and Pfizer. 2. Compute the returns of SP500 for 2019. Same work for 2020. 3. For the next computations, use the returns you computed in questions 1 and 2. 2019 Average SP500 0,10% Average Amazon 0,08% Apple 1,75% Boeing 0,57% Coca Cola 0,86% Facebook 0,18% Johnson&J. 0,75% Mastercard 0,32% Microsoft 0,55% Netflix 0,10% Pfizer 0,92% SP500 Amazon Apple Boeing Coca Cola Facebook Johnson&J. Mastercard Microsoft Netflix Pfizer 2020 0,08% 0,24% 1,08% 1,12% 0,85% 0,15% 0,73% 0,24% 0,44% 0,24% 1,11% 2020 Sample Standard deviation Sample Standard deviation SP500 Amazon Apple Boeing Coca Cola Facebook Johnson&J. Mastercard Microsoft Netflix Pfizer 2019 0,0079 0,0144 0,0167 0,0183 0,0109 0,0175 0,0104 0,0135 0,0126 0,0219 0,0121 SP500 Amazon Apple Boeing Coca Cola Facebook Johnson&J. Mastercard Microsoft Netflix Pfizer 0,0217 0,0243 0,0297 0,0558 0,0219 0,0289 0,0193 0,0309 0,0277 0,0291 0,0228 Covariance Matrix 2019 Amazon Apple Boeing Coca Cola Facebook Johnson&J. Mastercard Microsoft Netflix Pfizer Amazon Apple Boeing Coca Cola Facebook Johnson&J. Mastercard Microsoft Netflix Pfizer 0,0002069 0,000143 7,463E-05 3,047E-05 0,000155 3,8998E-05 0,00011833 0,000131 0,00016916 5,487E-05 0,000143 0,000279 0,000102 0,000030 0,000140 0,000043 0,000123 0,000131 0,000143 0,000060 7,463E-05 0,000102 0,000334261 1,06872E-05 8,95091E-05 4,3378E-05 6,6286E-05 8,205E-05 0,00010187 2,46126E-05 3,047E-05 0,000030 1,06872E-05 0,000118044 2,09449E-05 2,0438E-05 4,0521E-05 3,667E-05 1,2195E-05 3,21929E-05 0,000155 0,0001408,95091E-05 2,09449E-05 0,000305229 3,8479E-05 0,00013186 0,0001172 0,00016011 5,89684E-05 3,8998E-05 0,000043 4,3378E-05 2,0438E-05 3,8479E-05 0,00010821 3,5073E-05 3,991E-05 6,5763E-05 3,7973E-05 0,0001183 0,000123 6,6286E-05 4,0521E-05 0,00013186 3,5073E-05 0,00018205 0,0001265 0,00011777 5,5341E-05 0,0001311 0,000131 8,205E-05 3,667E-05 0,0001172 3,9915E-05 0,0001265 0,0001586 0,0001346 5,002E-05 0,000169 0,000143 0,000102 1,2195E-05 0,00016011 6,5763E-05 0,00011777 0,0001346 0,0004774 0,0000607 5,487E-05 0,000060 2,46126E-05 3,21929E-05 5,89684E-05 3,7973E-05 5,5341E-05 5,002E-05 0,0000607 0,0001461 Covariance Matrix 2020 Amazon Apple Boeing Coca Cola Facebook Johnson&J. Mastercard Microsoft Netflix Pfizer Amazon Apple Boeing Coca Cola Facebook Johnson&J. Mastercard Microsoft Netflix Pfizer 0,0005885 0,000505 0,0003092 0,0001666 0,0004785 0,0001938 0,0003319 0,0004969 0,0004795 0,0001808 0,000505 0,000882 0,000752 0,000354 0,00066 0,000344 0,000627 0,000691 0,000484 0,00032 0,0003092 0,000752 0,003112 0,000782 0,000620 0,000440 0,001146 0,000703 0,000317 0,000551 0,0001666 0,000354 0,000782 0,000481 0,000277 0,000297 0,000503 0,000352 0,000138 0,000313 0,0004785 0,00066 0,000620 0,000277 0,000838 0,000268 0,000560 0,000612 0,000484 0,000260 0,0001938 0,000344 0,000440 0,000297 0,000268 0,000371 0,000386 0,000358 0,000160 0,000319 0,0003319 0,000627 0,001146 0,000503 0,000560 0,000386 0,000953 0,000639 0,000252 0,000404 0,0004969 0,000691 0,000703 0,000352 0,000612 0,000358 0,000639 0,000769 0,000483 0,000343 0,0004795 0,000484 0,000317 0,000138 0,000484 0,000160 0,000252 0,000483 0,000849 0,000151 0,0001808 0,00032 0,000551 0,000313 0,000260 0,000319 0,000404 0,000343 0,000151 0,000522 Pfizer Correlation Matrix 2019 Amazon Apple Boeing Coca Cola Facebook Johnson&J. Mastercard Microsoft Netflix Pfizer Amazon Apple Boeing Coca Cola Facebook Johnson&J. Mastercard Microsoft Netflix 1 0,597194 0,2837884 0,1949962 0,6166703 0,2606281 0,6097052 0,7237931 0,5382036 0,597194 1 0,334379 0,16622 0,479147 0,24968 0,543763 0,621872 0,391686 0,2837884 0,334379 1 0,0538 0,28023 0,22809 0,26871 0,35634 0,255002 0,1949962 0,16622 0,0538 0,11034 0,18084 0,27642 0,26801 0,05137 0,6166703 0,479147 0,28023 0,11034 1 0,21173 0,55939 0,53277 0,41942 0,2606281 0,24968 0,22809 0,18084 0,21173 1 0,24989 0,30468 0,28933 0,6097052 0,543763 0,26871 0,27642 0,55939 0,24989 1 0,74458 0,39947 0,7237931 0,621872 0,35634 0,26801 0,53277 0,30468 0,74458 1 0,48925 0,5382036 0,391686 0,255002 0,05137 0,41942 0,28933 0,39947 0,48925 1 0,3155855 0,297288 0,11138 0,24515 0,27925 0,30202 0,33935 0,32862 0,22997 0,3155855 0,297288 0,11138 0,24515 0,27925 0,30202 0,33935 0,32862 0,22997 1 Correlation Matrix 2020 Amazon Apple Boeing Coca Cola Facebook Johnson&J. Mastercard Microsoft Netflix Pfizer Amazon Apple Boeing Coca Cola Facebook Johnson&J. Mastercard Microsoft Netflix Pfizer 1 0,700547 0,2281481 0,3137151 0,6820435 0,4159137 0,4434378 0,738937 0,6816033 0,3265338 0,700547 1 0,453791 0,54503 0,768285 0,60382 0,684780 0,839879 0,563167 0,472141 0,2281481 0,453791 1 0,6393 0,38449 0,41065 0,66579 0,45419 0,196253 0,43224 0,3137151 0,545027 0,6393 1 0,43549 0,70425 0,74343 0,57933 0,21466 0,62390 0,6820435 0,768285 0,38449 0,43549 1 0,48096 0,62648 0,76185 0,57456 0,39284 0,4159137 0,603816 0,41065 0,70425 0,48096 1 0,64945 0,67060 0,28478 0,72476 0,4434378 0,68478 0,66579 0,74343 0,62648 0,64945 1 0,74659 0,28076 0,57279 0,7237931 0,839879 0,45419 0,57933 0,76185 0,67060 0,74659 1 0,59895 0,54149 0,68160330,563167 0,196253 0,21466 0,57456 0,28478 0,28076 0,59895 0,22751 0,3265338 0,472141 0,43224 0,62390 0,39284 0,72476 0,57279 0,54149 0,22751