

Answered step by step
Verified Expert Solution
Question
1 Approved Answer
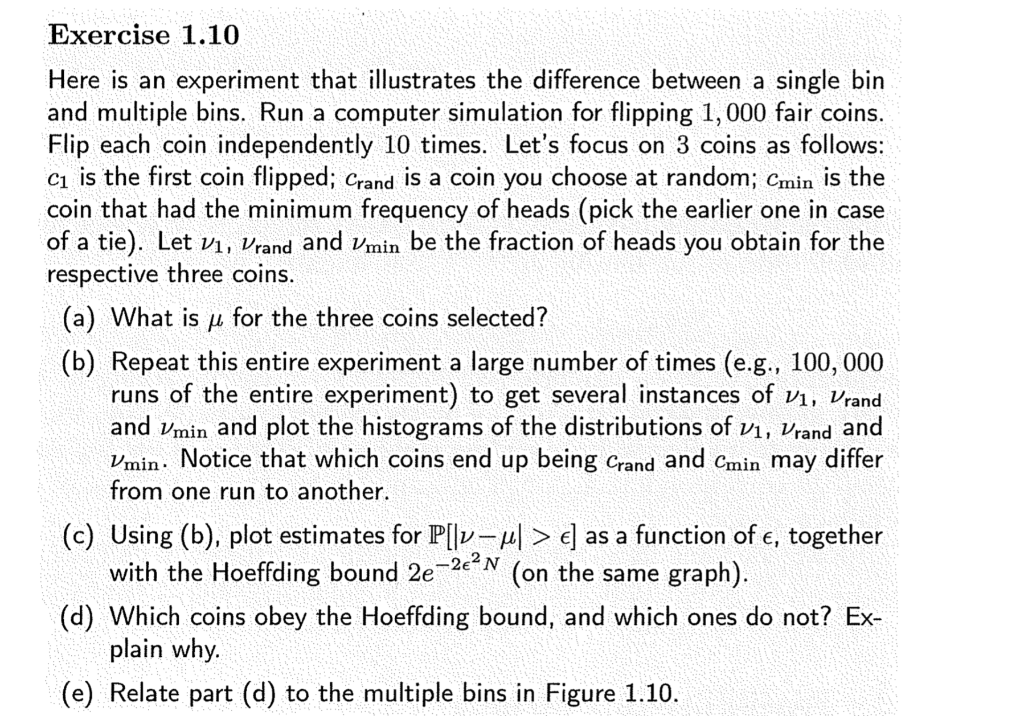
Exercise 1.10 Here is an experiment that illustrates the difference between a single bin and multiple bins. Run a computer simulation for flipping 1,000 fair
Step by Step Solution
There are 3 Steps involved in it
Step: 1

Get Instant Access to Expert-Tailored Solutions
See step-by-step solutions with expert insights and AI powered tools for academic success
Step: 2

Step: 3
Ace Your Homework with AI
Get the answers you need in no time with our AI-driven, step-by-step assistance
Get Started
Database Systems For Advanced Applications 27th International Conference Dasfaa 2022 Virtual Event April 11 14 2022 Proceedings Part 2 Lncs 13246
Authors: Arnab Bhattacharya ,Janice Lee Mong Li ,Divyakant Agrawal ,P. Krishna Reddy ,Mukesh Mohania ,Anirban Mondal ,Vikram Goyal ,Rage Uday Kiran
1st Edition
3031001257, 978-3031001253