

Answered step by step
Verified Expert Solution
Question
1 Approved Answer
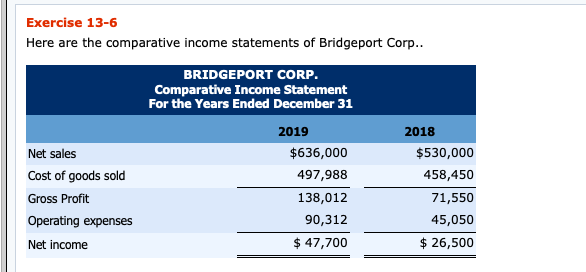
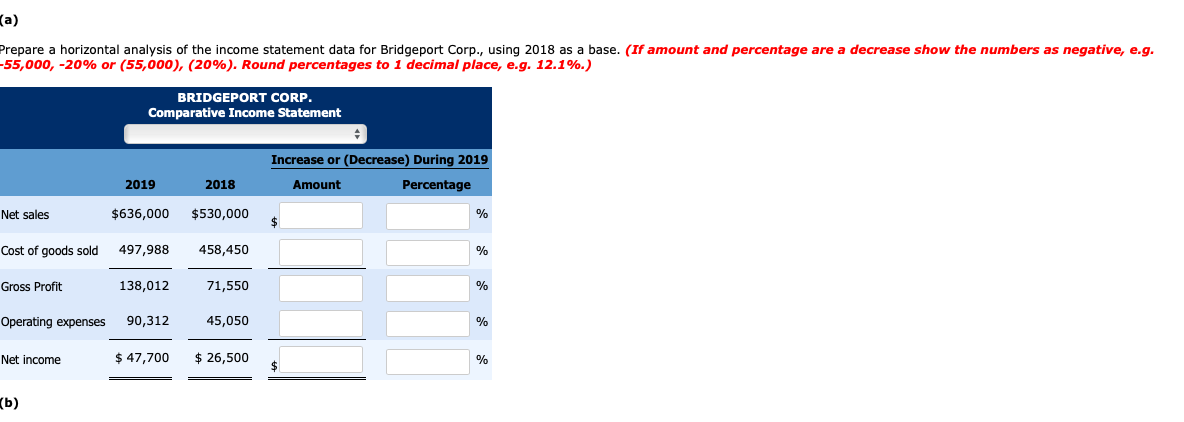
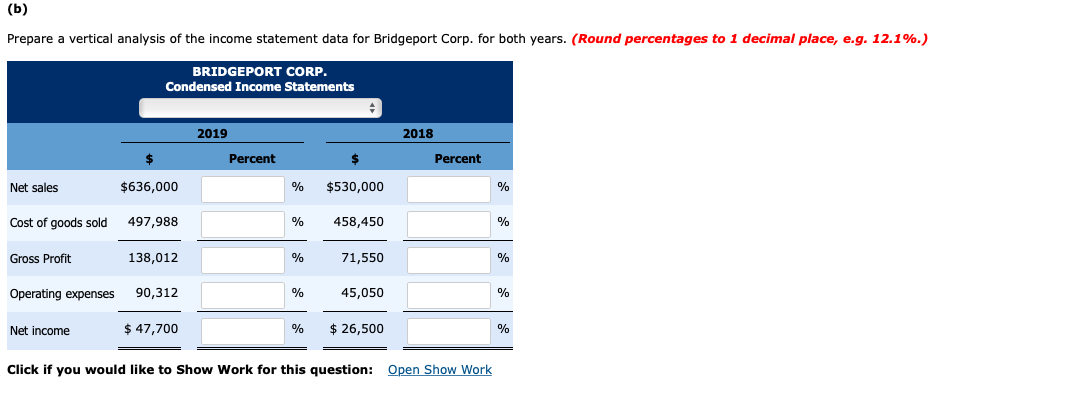
Exercise 13-6 Here are the comparative income statements of Bridgeport Corp.. BRIDGEPORT CORP. Comparative Income Statement For the Years Ended December 31 Net sales Cost
Step by Step Solution
There are 3 Steps involved in it
Step: 1

Get Instant Access to Expert-Tailored Solutions
See step-by-step solutions with expert insights and AI powered tools for academic success
Step: 2

Step: 3
Ace Your Homework with AI
Get the answers you need in no time with our AI-driven, step-by-step assistance
Get Started
I Love My Awesome Auditor
Authors: Lovely Hearts Publishing
1st Edition
1794298169, 978-1794298163