

Answered step by step
Verified Expert Solution
Question
1 Approved Answer
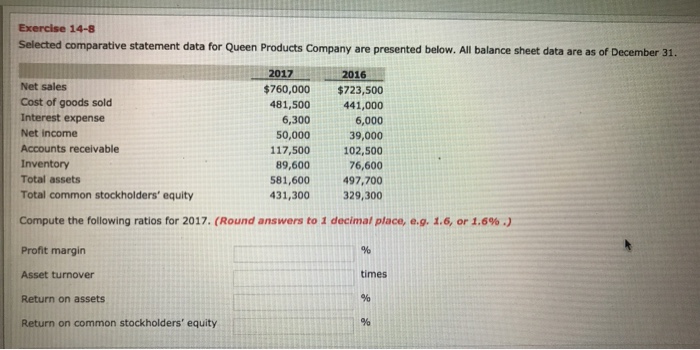
Exercise 14-8 Selected comparative statement data for Queen Products Company are presented below. All balance sheet data are as of December 31. 2017 Net sales
Step by Step Solution
There are 3 Steps involved in it
Step: 1

Get Instant Access to Expert-Tailored Solutions
See step-by-step solutions with expert insights and AI powered tools for academic success
Step: 2

Step: 3
Ace Your Homework with AI
Get the answers you need in no time with our AI-driven, step-by-step assistance
Get Started
Financial Accounting A Concepts Based Introduction
Authors: David Kolitz
1st Edition
1138844977, 978-1138844971