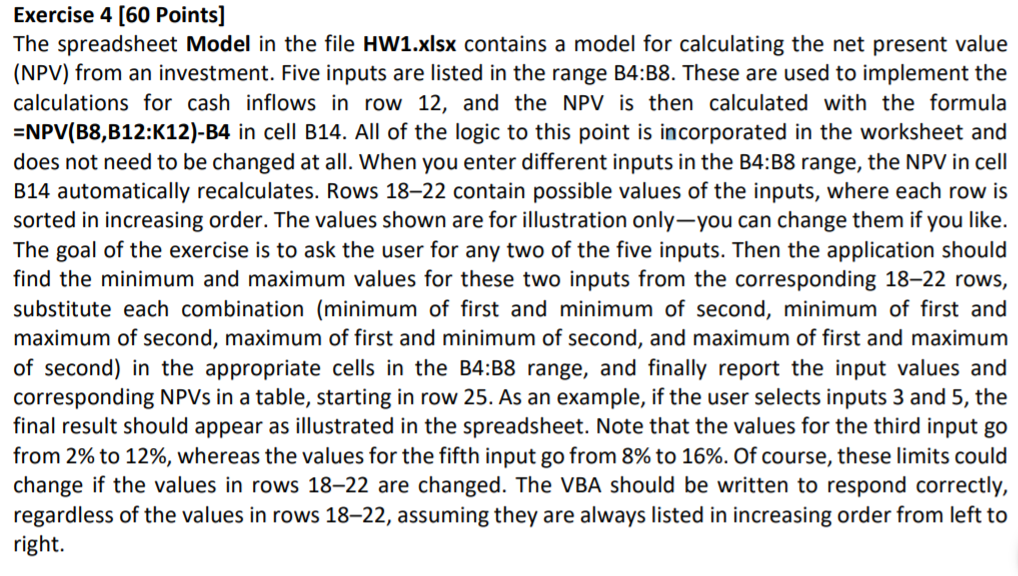
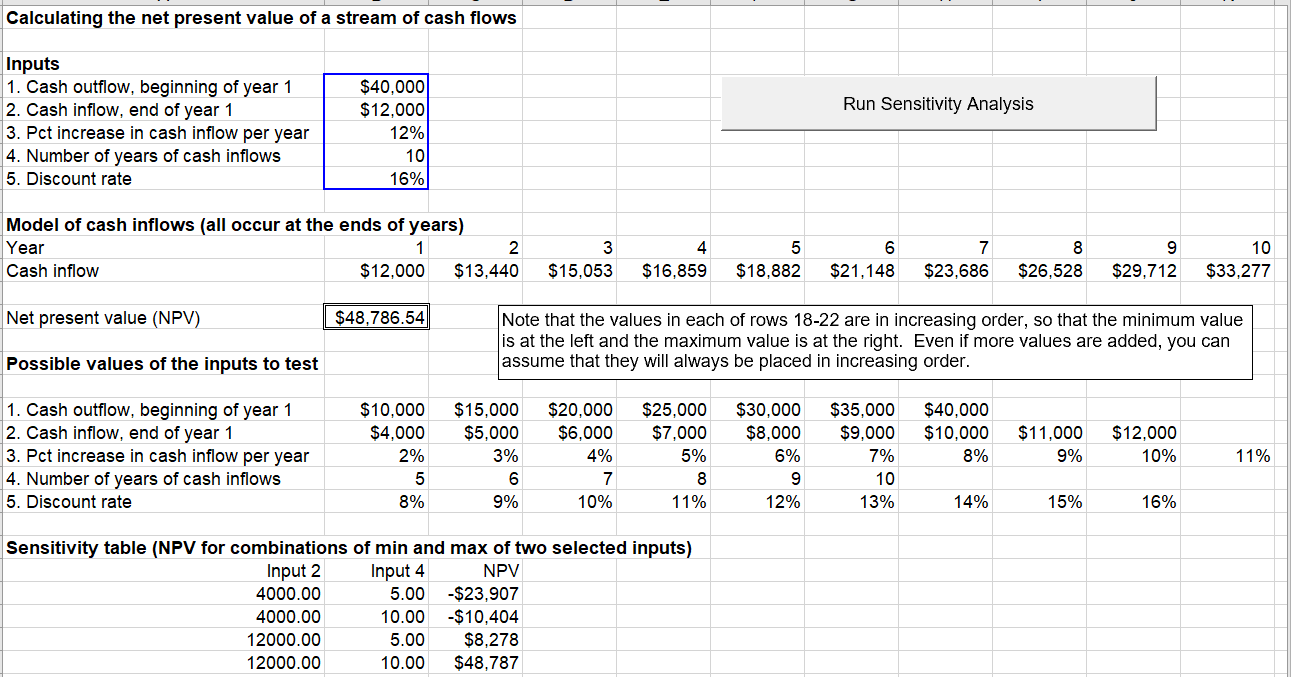
Exercise 4 [60 Points] The spreadsheet Model in the file HW1.xlsx contains a model for calculating the net present value (NPV) from an investment. Five inputs are listed in the range B4:38. These are used to implement the calculations for cash inflows in row 12, and the NPV is then calculated with the formula =NPV(B8,B12:K12)-B4 in cell B14. All of the logic to this point is incorporated in the worksheet and does not need to be changed at all. When you enter different inputs in the B4:B8 range, the NPV in cell B14 automatically recalculates. Rows 1822 contain possible values of the inputs, where each row is sorted in increasing order. The values shown are for illustration only-you can change them if you like. The goal of the exercise is to ask the user for any two of the five inputs. Then the application should find the minimum and maximum values for these two inputs from the corresponding 1822 rows, substitute each combination (minimum of first and minimum of second, minimum of first and maximum of second, maximum of first and minimum of second, and maximum of first and maximum of second) in the appropriate cells in the B4:38 range, and finally report the input values and corresponding NPVs in a table, starting in row 25. As an example, if the user selects inputs 3 and 5, the final result should appear as illustrated in the spreadsheet. Note that the values for the third input go from 2% to 12%, whereas the values for the fifth input go from 8% to 16%. Of course, these limits could change if the values in rows 1822 are changed. The VBA should be written to respond correctly, regardless of the values in rows 1822, assuming they are always listed in increasing order from left to right. Calculating the net present value of a stream of cash flows Run Sensitivity Analysis Inputs 1. Cash outflow, beginning of year 1 2. Cash inflow, end of year 1 3. Pct increase in cash inflow per year 4. Number of years of cash inflows 5. Discount rate $40,000 $12,000 12% 10 16% Model of cash inflows (all occur at the ends of years) Year 1 2 Cash inflow $12,000 $13.440 3 $15,053 4 $16.859 5 $18,882 6 $21,148 7 $23,686 8 $26,528 9 $29,712 10 $33,277 Net present value (NPV) $48,786.54 Note that the values in each of rows 18-22 are in increasing order, so that the minimum value is at the left and the maximum value is at the right. Even if more values are added, you can assume that they will always be placed in increasing order. Possible values of the inputs to test $20,000 $6,000 1. Cash outflow, beginning of year 1 2. Cash inflow, end of year 1 3. Pct increase in cash inflow per year 4. Number of years of cash inflows 5. Discount rate $10,000 $4,000 2% 5 8% $15,000 $5,000 3% 6 9% $25,000 $7,000 5% 8 11% $30,000 $8,000 6% 9 12% $35,000 $9,000 7% 10 13% $40,000 $10,000 8% 4% $11,000 9% $12,000 10% 11% 7 10% 14% 15% 16% Sensitivity table (NPV for combinations of min and max of two selected inputs) Input 2 Input 4 NPV 4000.00 5.00 -$23,907 4000.00 10.00 -$10,404 12000.00 5.00 $8.278 12000.00 10.00 $48,787 Exercise 4 [60 Points] The spreadsheet Model in the file HW1.xlsx contains a model for calculating the net present value (NPV) from an investment. Five inputs are listed in the range B4:38. These are used to implement the calculations for cash inflows in row 12, and the NPV is then calculated with the formula =NPV(B8,B12:K12)-B4 in cell B14. All of the logic to this point is incorporated in the worksheet and does not need to be changed at all. When you enter different inputs in the B4:B8 range, the NPV in cell B14 automatically recalculates. Rows 1822 contain possible values of the inputs, where each row is sorted in increasing order. The values shown are for illustration only-you can change them if you like. The goal of the exercise is to ask the user for any two of the five inputs. Then the application should find the minimum and maximum values for these two inputs from the corresponding 1822 rows, substitute each combination (minimum of first and minimum of second, minimum of first and maximum of second, maximum of first and minimum of second, and maximum of first and maximum of second) in the appropriate cells in the B4:38 range, and finally report the input values and corresponding NPVs in a table, starting in row 25. As an example, if the user selects inputs 3 and 5, the final result should appear as illustrated in the spreadsheet. Note that the values for the third input go from 2% to 12%, whereas the values for the fifth input go from 8% to 16%. Of course, these limits could change if the values in rows 1822 are changed. The VBA should be written to respond correctly, regardless of the values in rows 1822, assuming they are always listed in increasing order from left to right. Calculating the net present value of a stream of cash flows Run Sensitivity Analysis Inputs 1. Cash outflow, beginning of year 1 2. Cash inflow, end of year 1 3. Pct increase in cash inflow per year 4. Number of years of cash inflows 5. Discount rate $40,000 $12,000 12% 10 16% Model of cash inflows (all occur at the ends of years) Year 1 2 Cash inflow $12,000 $13.440 3 $15,053 4 $16.859 5 $18,882 6 $21,148 7 $23,686 8 $26,528 9 $29,712 10 $33,277 Net present value (NPV) $48,786.54 Note that the values in each of rows 18-22 are in increasing order, so that the minimum value is at the left and the maximum value is at the right. Even if more values are added, you can assume that they will always be placed in increasing order. Possible values of the inputs to test $20,000 $6,000 1. Cash outflow, beginning of year 1 2. Cash inflow, end of year 1 3. Pct increase in cash inflow per year 4. Number of years of cash inflows 5. Discount rate $10,000 $4,000 2% 5 8% $15,000 $5,000 3% 6 9% $25,000 $7,000 5% 8 11% $30,000 $8,000 6% 9 12% $35,000 $9,000 7% 10 13% $40,000 $10,000 8% 4% $11,000 9% $12,000 10% 11% 7 10% 14% 15% 16% Sensitivity table (NPV for combinations of min and max of two selected inputs) Input 2 Input 4 NPV 4000.00 5.00 -$23,907 4000.00 10.00 -$10,404 12000.00 5.00 $8.278 12000.00 10.00 $48,787