EXERCISE 8C Determine the Cash Value of Coca-Cola
Purpose It is simply good business to continually know the cash value (corporate valuation) of your company. This exercise gives you practice in determining the total worth of a company using several methods. To perform this analysis, use Coca-Colas financial statements as given in the Cohesion Case.
Instructions:
Step 1 :
Calculate the financial worth of Coca-Cola based on four approaches: (1) the net worth method, (2) the net income method, (3) the price-earnings ratio method, and (4) the out-standing shares method.
Step 2:
Get an average of the four methods. In a dollar amount, how much is Coca-Cola worth?
Step 3:
Determine the Goodwill/Total Assets
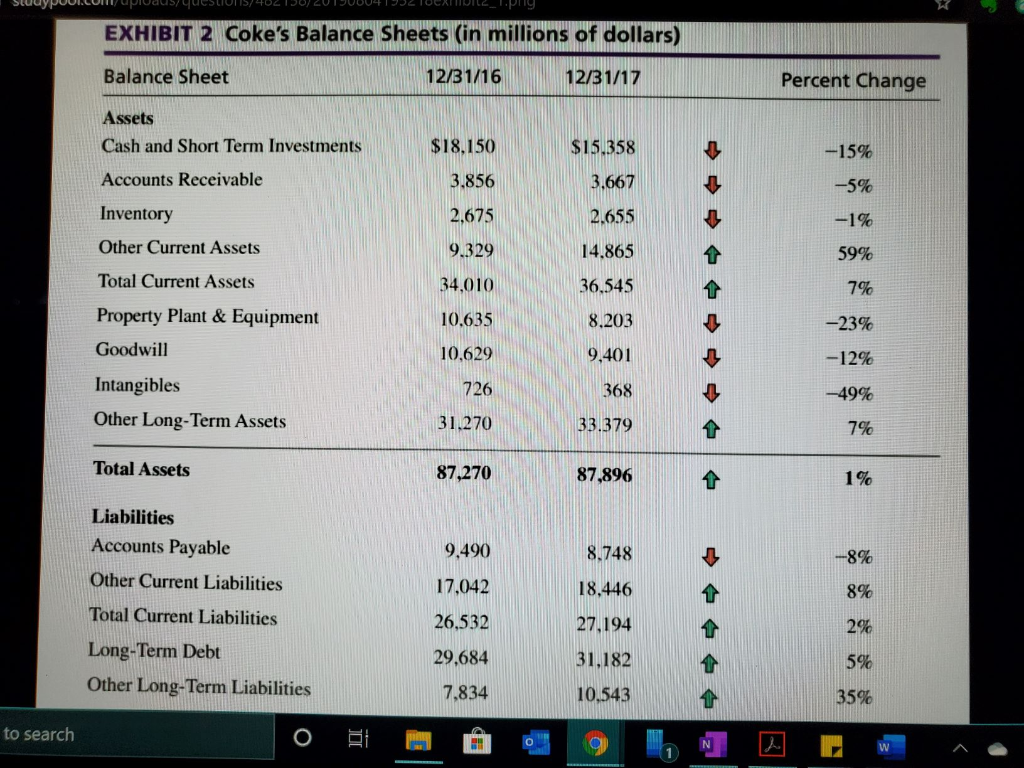
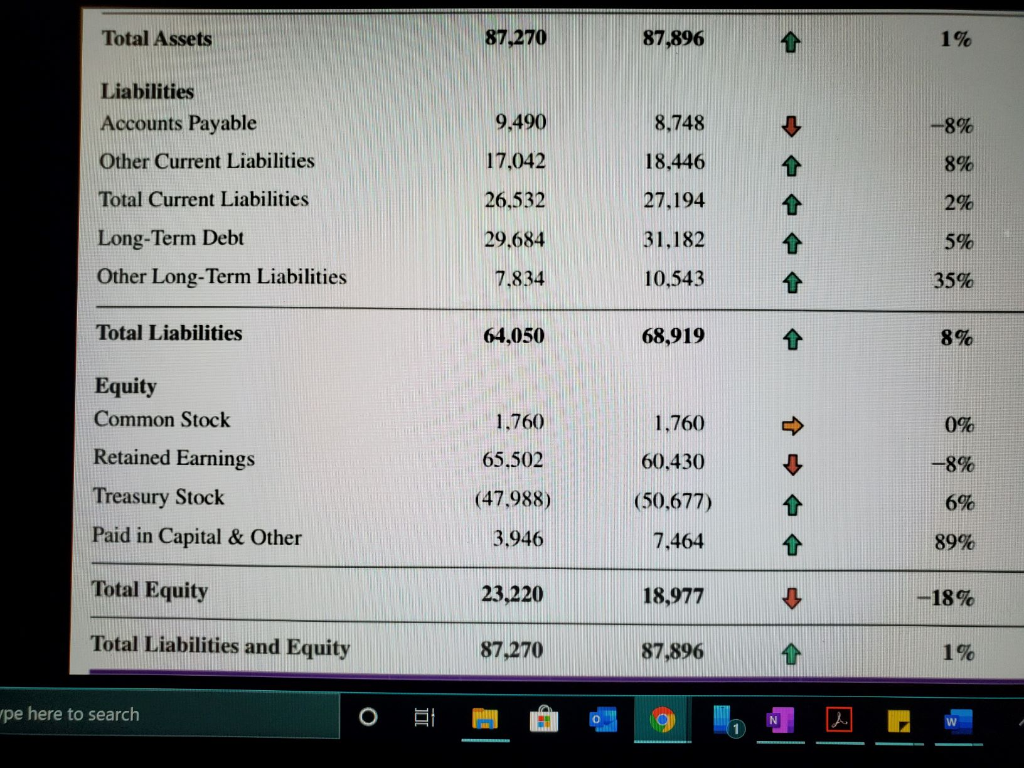
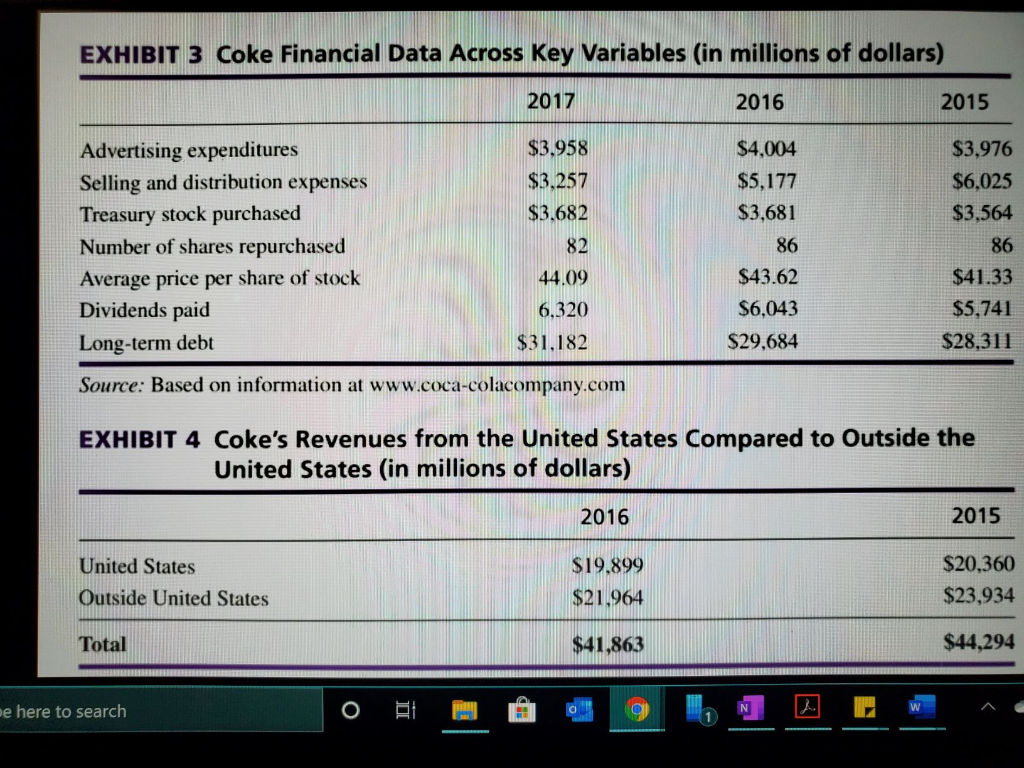
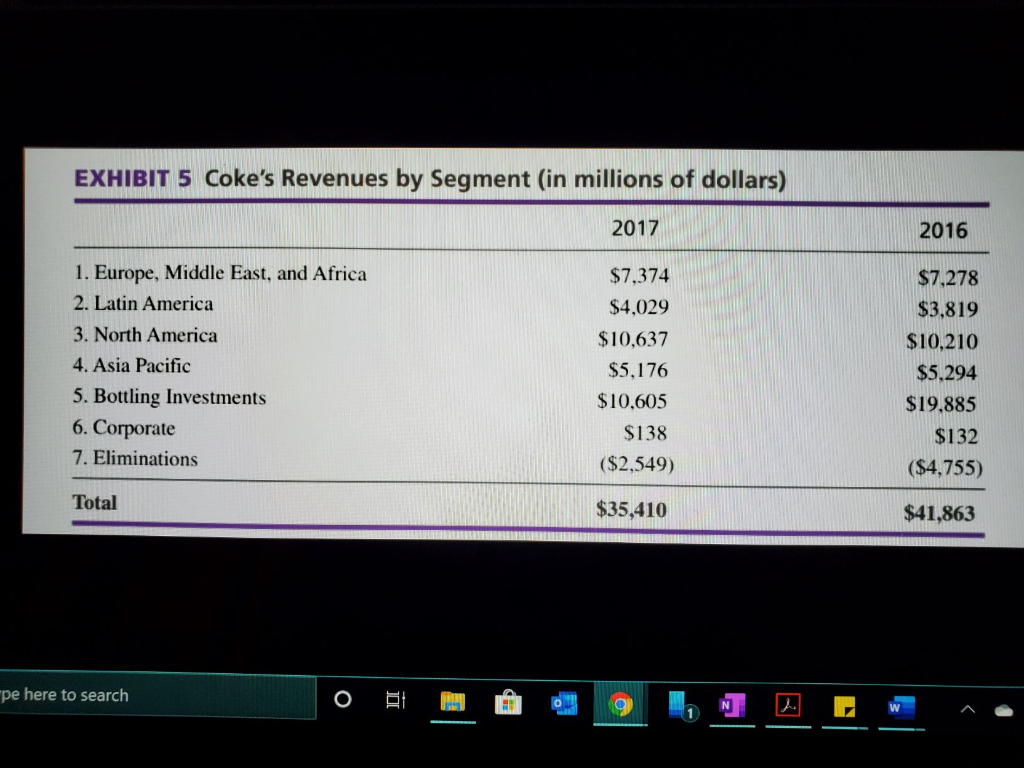
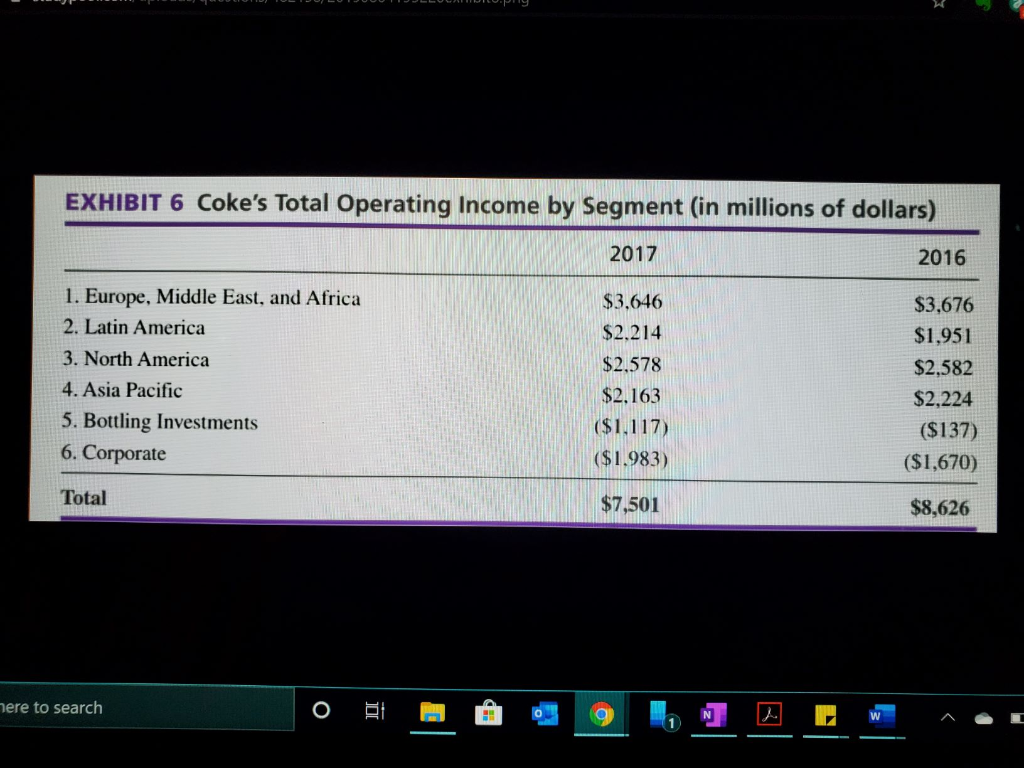
EXHIBIT 2 Coke's Balance Sheets (in millions of dollars) Balance Sheet 12/31/16 12/31/17 Percent Change $18.150 3,856 2.675 9.329 Assets Cash and Short Term Investments Accounts Receivable Inventory Other Current Assets Total Current Assets Property Plant & Equipment Goodwill Intangibles Other Long-Term Assets $15.358 3.667 2.655 14,865 36,545 8.203 -15% -5% -1% 59% 34.010 7% 10.635 10,629 9,401 -23% -12% -49% 7% 726 368 33.379 31.270 Total Assets 87,270 87,896 9,490 8.748 --8% 18,446 8% Liabilities Accounts Payable Other Current Liabilities Total Current Liabilities Long-Term Debt Other Long-Term Liabilities 2% 17,042 26,532 29,684 7,834 27,194 31,182 10,543 5% 35% to search Total Assets 87,270 87,896 1% 9,490 --8% 8% Liabilities Accounts Payable Other Current Liabilities Total Current Liabilities Long-Term Debt Other Long-Term Liabilities 8.748 18,446 27,194 31,182 10,543 17,042 26,532 29,684 7,834 2% 5% 35% Total Liabilities 64,050 68,919 8% 0% Equity Common Stock Retained Earnings Treasury Stock Paid in Capital & Other 1,760 60,430 (50,677) 1,760 65.502 (47,988) 3,946 -8% 6% 7,464 89% Total Equity 23,220 18,977 -18% Total Liabilities and Equity 87,270 87,896 1% pe here to search of A N E W EXHIBIT 3 Coke Financial Data Across Key Variables (in millions of dollars) 2017 2016 2015 $3.958 $3,257 $3,682 Advertising expenditures Selling and distribution expenses Treasury stock purchased Number of shares repurchased Average price per share of stock Dividends paid Long-term debt 82 $4,004 $5,177 $3,681 86 $43.62 $6,043 $29,684 $3,976 $6,025 $3,564 86 $41.33 $5,741 $28,311 44.09 6,320 $31,182 Source: Based on information at www.coca-colacompany.com EXHIBIT 4 Coke's Revenues from the United States Compared to Outside the United States (in millions of dollars) 2016 2015 United States Outside United States $19,899 $21,964 $20,360 $23,934 Total $41,863 $44,294 me here to search o d EW EXHIBIT 5 Coke's Revenues by Segment (in millions of dollars) 2017 2016 1. Europe, Middle East, and Africa 2. Latin America 3. North America 4. Asia Pacific 5. Bottling Investments 6. Corporate 7. Eliminations $7,374 $4,029 $10,637 $5,176 $10,605 $138 ($2,549) $7,278 $3,819 $10,210 $5.294 $19.885 $132 ($4,755) Total $35,410 $41,863 pe here to search EXHIBIT 6 Coke's Total Operating Income by Segment (in millions of dollars) 2017 2016 1. Europe, Middle East, and Africa 2. Latin America 3. North America 4. Asia Pacific 5. Bottling Investments 6. Corporate $3,646 $2.214 $2,578 $2.163 ($1.117) ($1.983) $3,676 $1,951 $2,582 $2,224 ($137) ($1,670) Total $7,501 $8,626 here to search EXHIBIT 2 Coke's Balance Sheets (in millions of dollars) Balance Sheet 12/31/16 12/31/17 Percent Change $18.150 3,856 2.675 9.329 Assets Cash and Short Term Investments Accounts Receivable Inventory Other Current Assets Total Current Assets Property Plant & Equipment Goodwill Intangibles Other Long-Term Assets $15.358 3.667 2.655 14,865 36,545 8.203 -15% -5% -1% 59% 34.010 7% 10.635 10,629 9,401 -23% -12% -49% 7% 726 368 33.379 31.270 Total Assets 87,270 87,896 9,490 8.748 --8% 18,446 8% Liabilities Accounts Payable Other Current Liabilities Total Current Liabilities Long-Term Debt Other Long-Term Liabilities 2% 17,042 26,532 29,684 7,834 27,194 31,182 10,543 5% 35% to search Total Assets 87,270 87,896 1% 9,490 --8% 8% Liabilities Accounts Payable Other Current Liabilities Total Current Liabilities Long-Term Debt Other Long-Term Liabilities 8.748 18,446 27,194 31,182 10,543 17,042 26,532 29,684 7,834 2% 5% 35% Total Liabilities 64,050 68,919 8% 0% Equity Common Stock Retained Earnings Treasury Stock Paid in Capital & Other 1,760 60,430 (50,677) 1,760 65.502 (47,988) 3,946 -8% 6% 7,464 89% Total Equity 23,220 18,977 -18% Total Liabilities and Equity 87,270 87,896 1% pe here to search of A N E W EXHIBIT 3 Coke Financial Data Across Key Variables (in millions of dollars) 2017 2016 2015 $3.958 $3,257 $3,682 Advertising expenditures Selling and distribution expenses Treasury stock purchased Number of shares repurchased Average price per share of stock Dividends paid Long-term debt 82 $4,004 $5,177 $3,681 86 $43.62 $6,043 $29,684 $3,976 $6,025 $3,564 86 $41.33 $5,741 $28,311 44.09 6,320 $31,182 Source: Based on information at www.coca-colacompany.com EXHIBIT 4 Coke's Revenues from the United States Compared to Outside the United States (in millions of dollars) 2016 2015 United States Outside United States $19,899 $21,964 $20,360 $23,934 Total $41,863 $44,294 me here to search o d EW EXHIBIT 5 Coke's Revenues by Segment (in millions of dollars) 2017 2016 1. Europe, Middle East, and Africa 2. Latin America 3. North America 4. Asia Pacific 5. Bottling Investments 6. Corporate 7. Eliminations $7,374 $4,029 $10,637 $5,176 $10,605 $138 ($2,549) $7,278 $3,819 $10,210 $5.294 $19.885 $132 ($4,755) Total $35,410 $41,863 pe here to search EXHIBIT 6 Coke's Total Operating Income by Segment (in millions of dollars) 2017 2016 1. Europe, Middle East, and Africa 2. Latin America 3. North America 4. Asia Pacific 5. Bottling Investments 6. Corporate $3,646 $2.214 $2,578 $2.163 ($1.117) ($1.983) $3,676 $1,951 $2,582 $2,224 ($137) ($1,670) Total $7,501 $8,626 here to search


