

Answered step by step
Verified Expert Solution
Question
1 Approved Answer
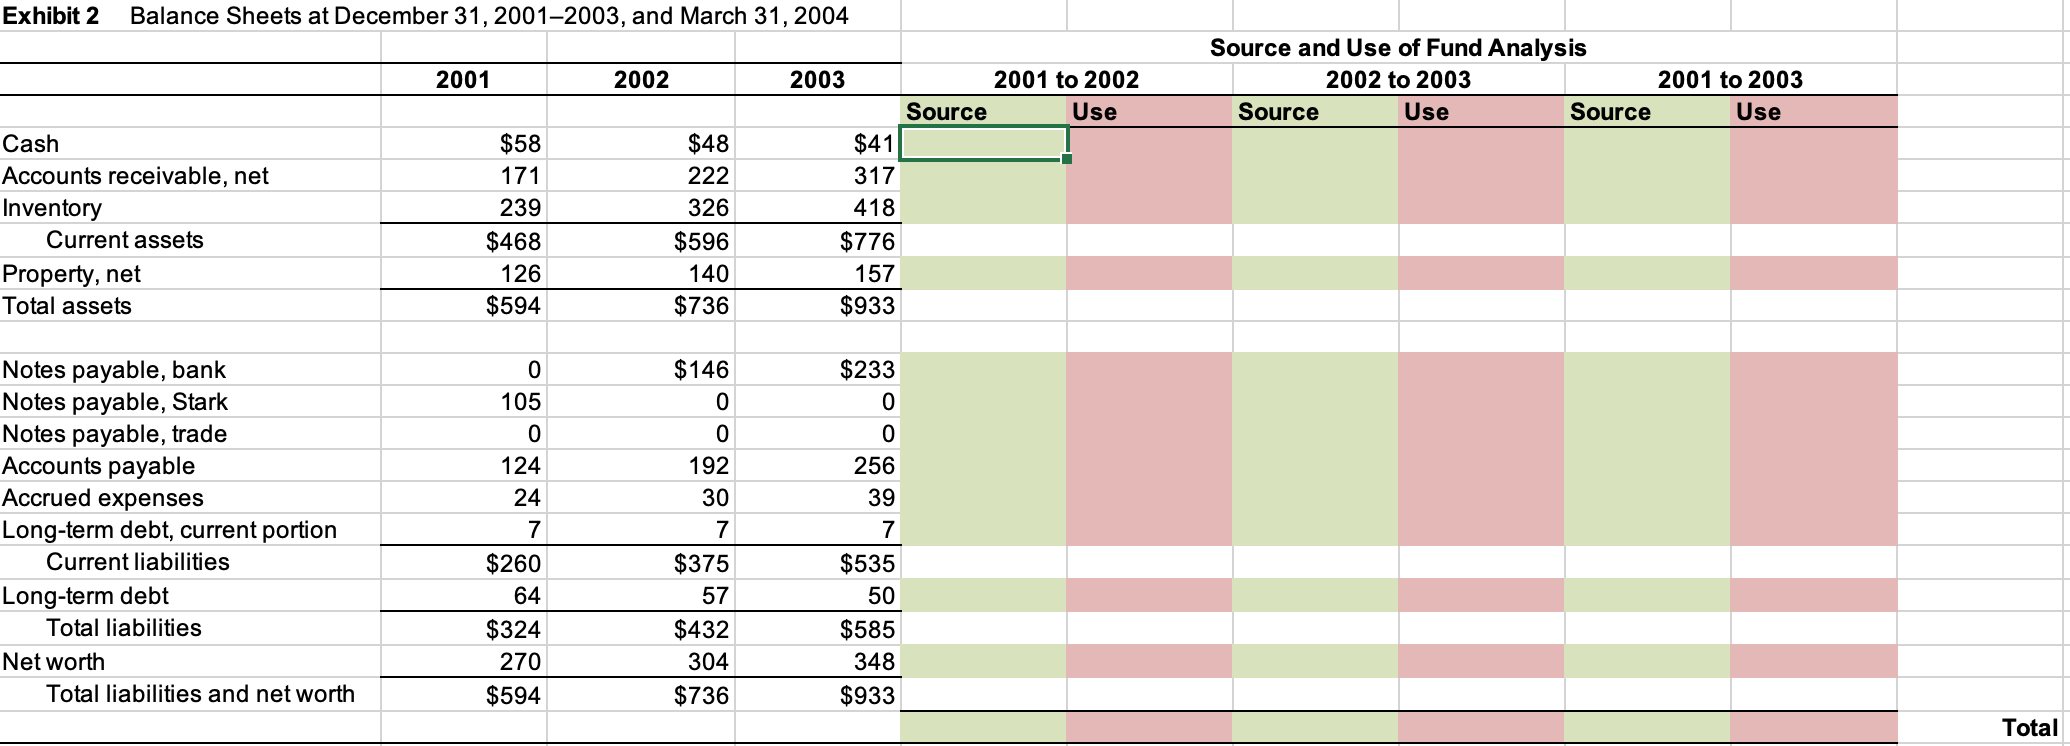
Exhibit 2 Balance Sheets at December 31, 2001-2003, and March 31, 2004 2001 2002 Source and Use of Fund Analysis 2002 to 2003 2001 to
Step by Step Solution
There are 3 Steps involved in it
Step: 1

Get Instant Access to Expert-Tailored Solutions
See step-by-step solutions with expert insights and AI powered tools for academic success
Step: 2

Step: 3
Ace Your Homework with AI
Get the answers you need in no time with our AI-driven, step-by-step assistance
Get Started
Guide For Investors The Main Concepts Of Blockchain Bitcoin Ethereum And Cryptocurrency
Authors: Neida Shadiack
1st Edition
979-8354075225