

Question
Exhibit 5.27 presents risk ratios for Starbucks for 2010 and 2011. Exhibits 1.26-1.28 present the financial statements for Starbucks. A. Compute the values of each
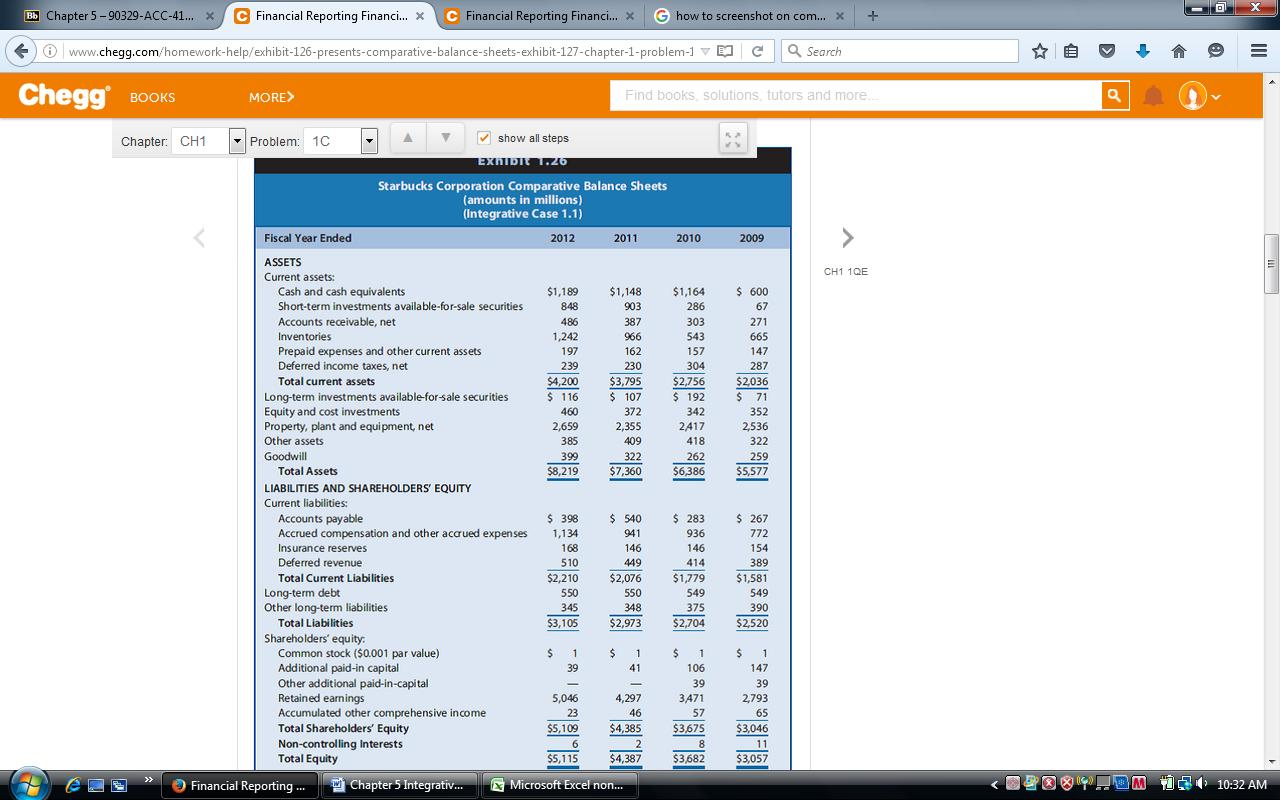
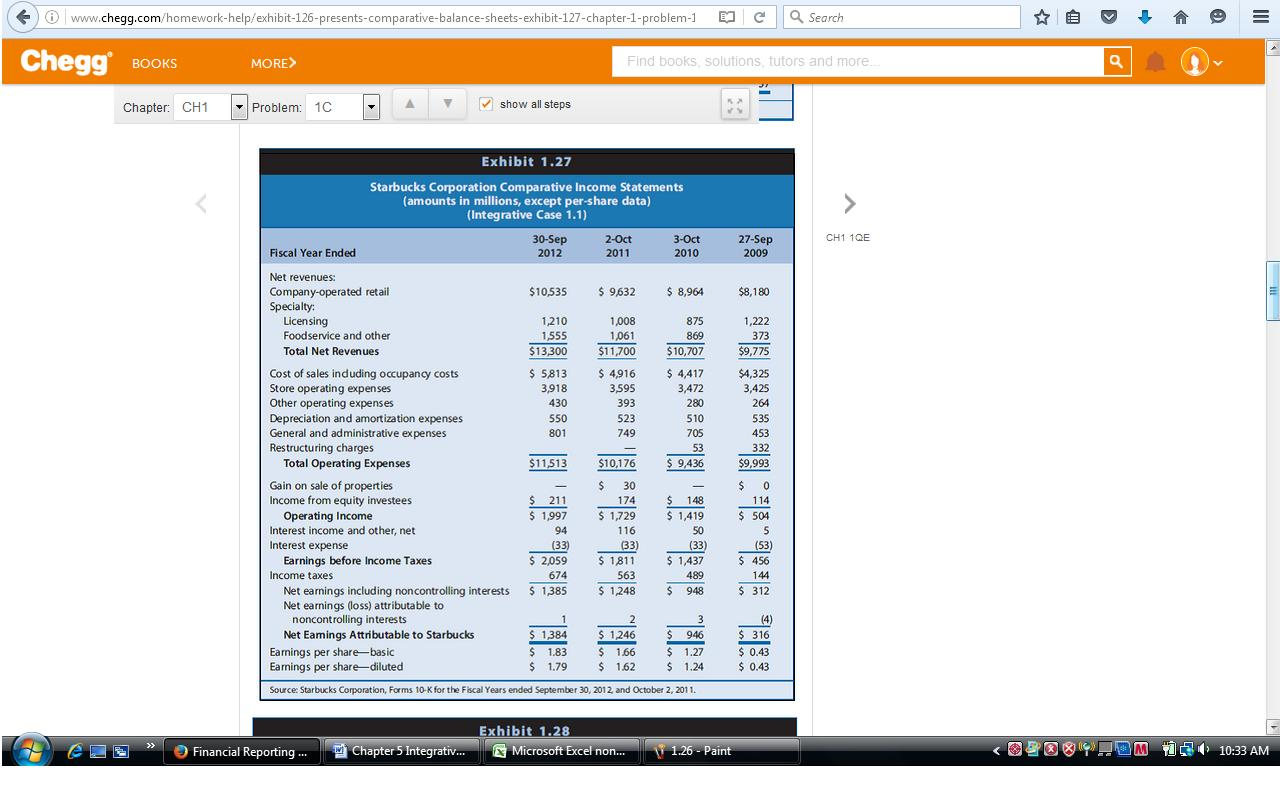
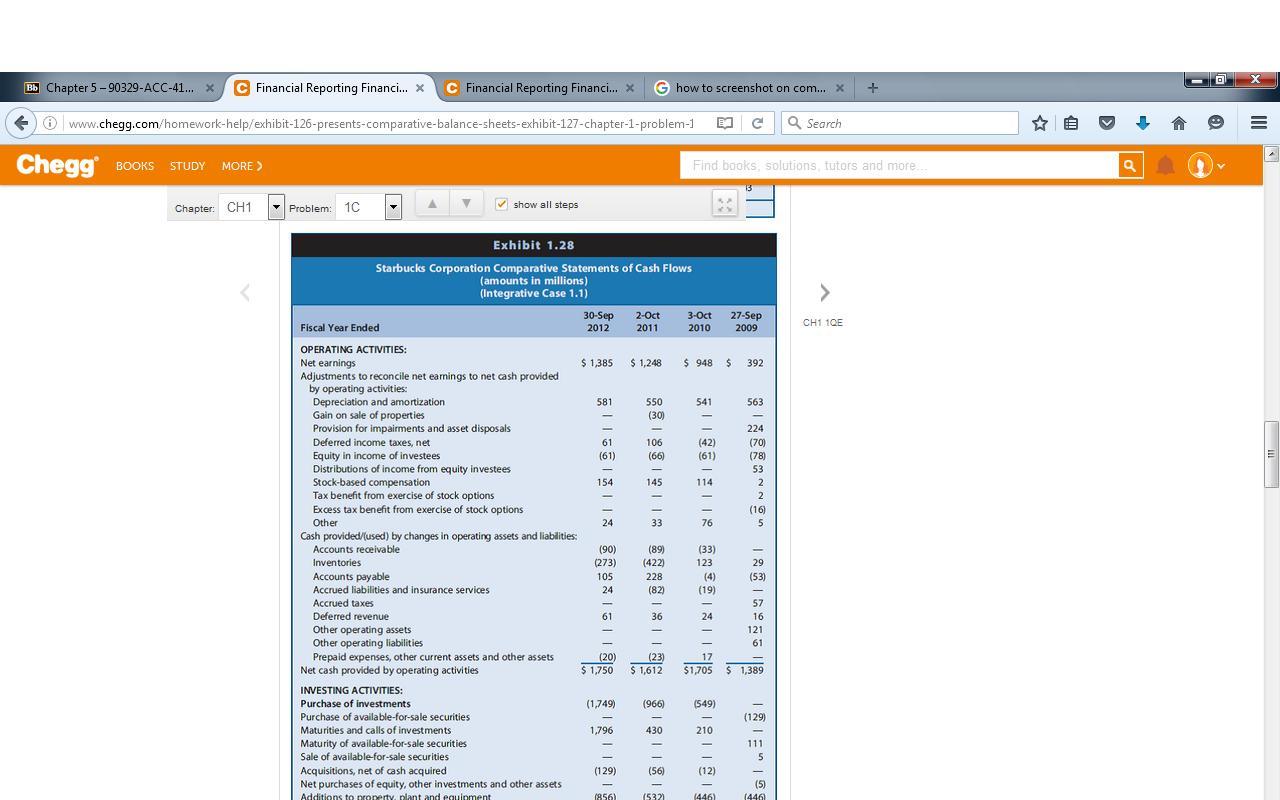
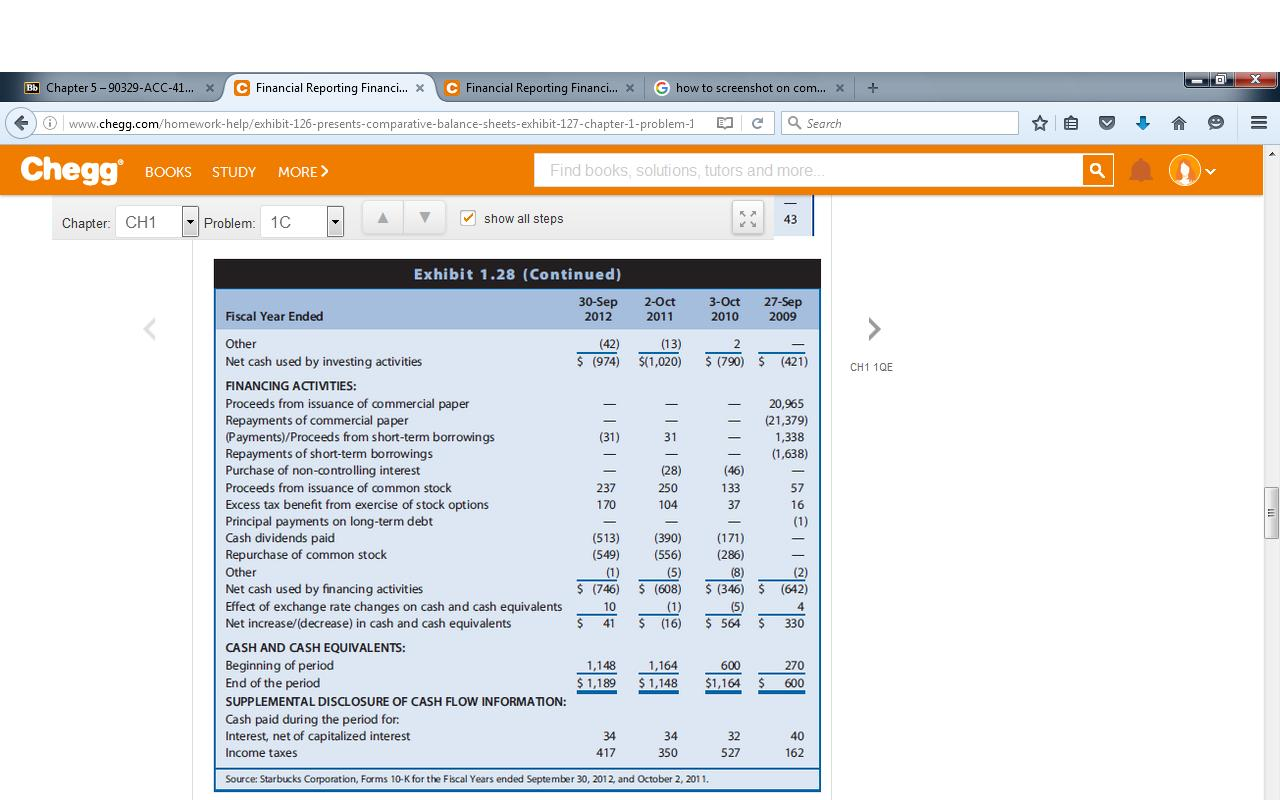
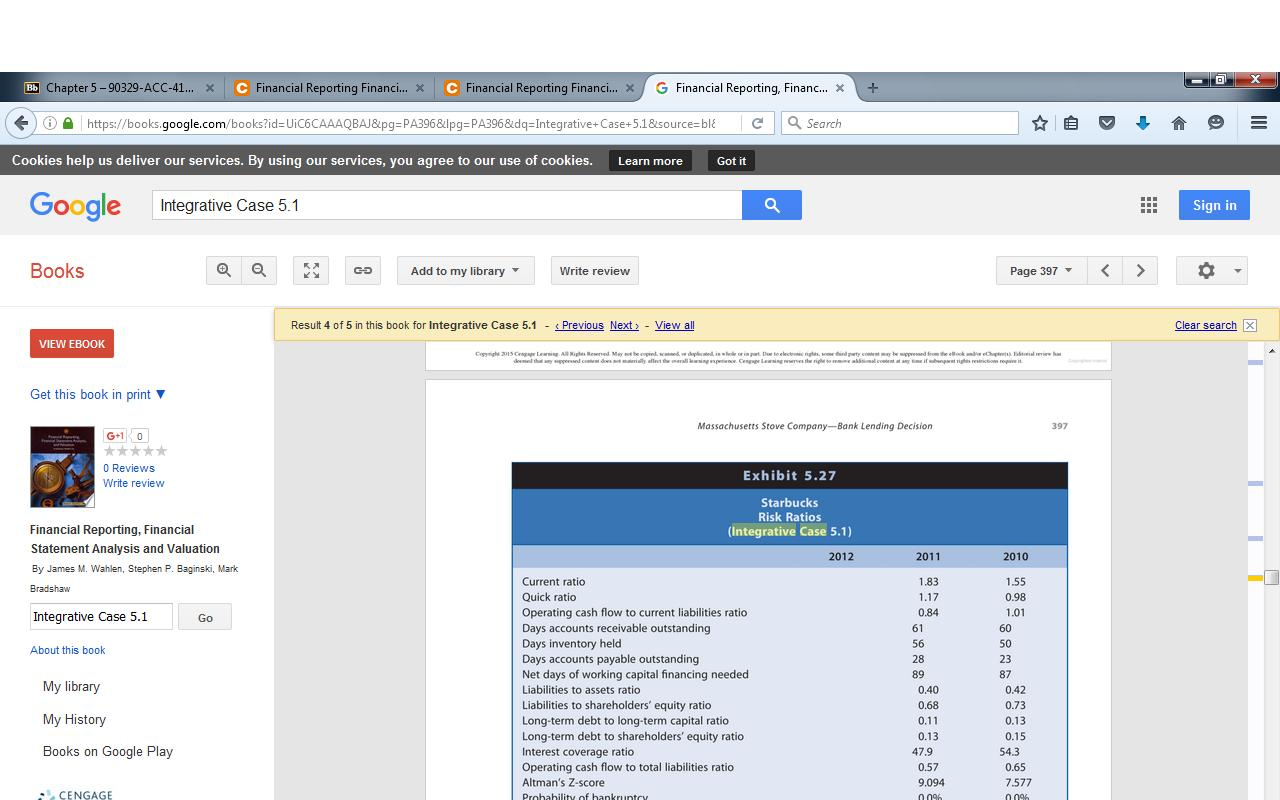
Exhibit 5.27 presents risk ratios for Starbucks for 2010 and 2011. Exhibits 1.26-1.28 present the financial statements for Starbucks.
A. Compute the values of each of the ratios in Exhibit 5.27 for Starbucks for 2012. Starbucks had 749.3 million common shares outstanding at the end of fiscal 2012, and the market price per share was $50.71. For days accounts receivable outstanding, use only speciallty revenues in your calculations, because accounts receivable are primarily related to licensing, and food service serive operations, but not retail operations. Please show calculations as well as answer.
B. Risk Assessment
Short-Term Liquidity Risk: Discuss current ratio, quick ratio, operating cash flow to 1. current liabilities ratio, days accounts receivable, days in inventory, days accounts payable in addressing this risk.Then, provide a concluding sentence summarizing this risk.
Long-Term Solvency Risk: Discuss long-term debt ratios, operating cash flow to total liabilities, interest rate coverage ratio in address this risk. Then, provide a concluding sentence summarizing this risk.
Bankruptcy Risk: Discuss Altmans Z-score. Then, provide a concluding sentence summarizing this risk.
Step by Step Solution
There are 3 Steps involved in it
Step: 1

Get Instant Access to Expert-Tailored Solutions
See step-by-step solutions with expert insights and AI powered tools for academic success
Step: 2

Step: 3
Ace Your Homework with AI
Get the answers you need in no time with our AI-driven, step-by-step assistance
Get Started
Construction Industry IRS Audit Techniques Guide
Authors: Internal Revenue Service
1st Edition
1304131920, 978-1304131928