Exhibits 1, 2, 5, 6, and 7? What positives and negatives do you see in Netflixs performance? Use the financial ratios in Table 4.1 of Chapter 4 as a guide in doing the calculations needed to arrive at an analysis-based answer to your assessment of Netflixs recent financial performance. Create a table showing you analysis and include your calculations.
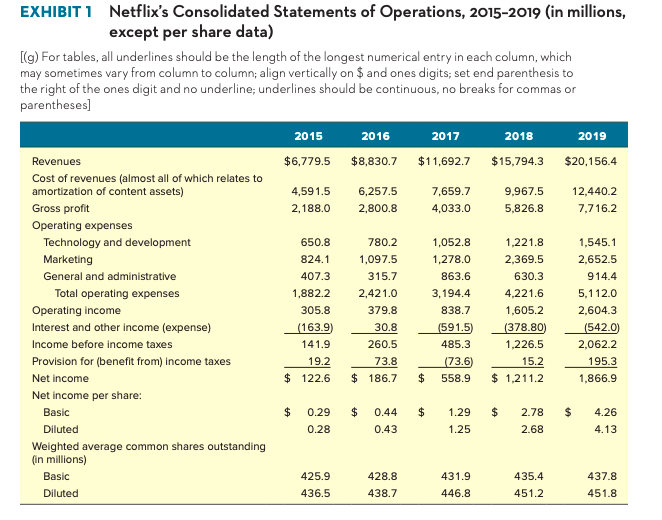
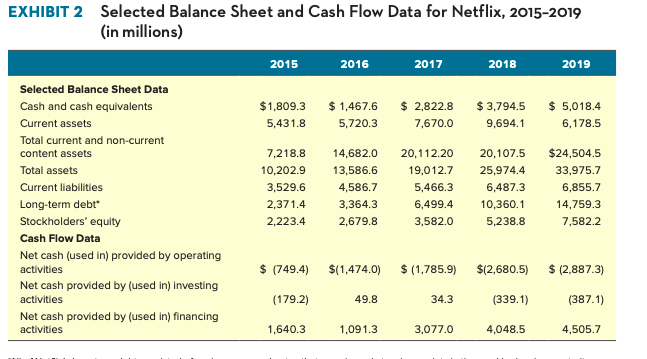
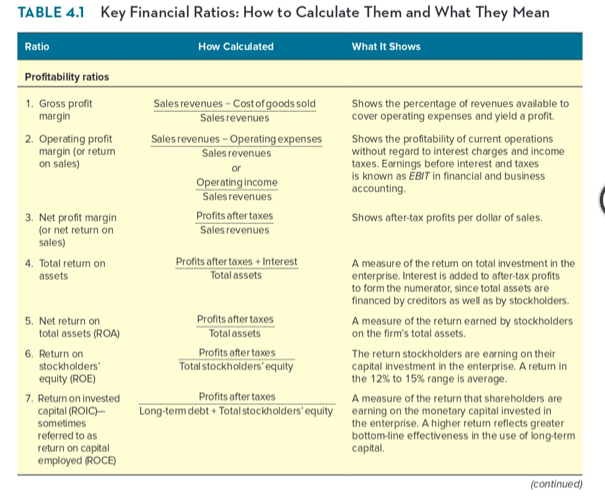
EXHIBIT 1 Netflix's Consolidated Statements of Operations, 2015-2019 (in millions, except per share data) [(g) For tables, all underlines should be the length of the longest numerical entry in each column, which may sometimes vary from column to column; align vertically on $ and ones digits; set end parenthesis to the right of the ones digit and no underline; underlines should be continuous, no breaks for commas or parentheses] 2015 2016 2017 2018 2019 Revenues $6,779.5 $8,830.7 $11,692.7 $15,794.3 $20,156.4 6,257.5 7,659.7 9,967.5 12,440.2 4,59 1.5 2,188.0 2,800.8 4,033.0 5,826.8 7.716.2 Cost of revenues (almost all of which relates to amortization of content assets) Gross profit Operating expenses Technology and development Marketing 650.8 780.2 1,052.8 1,221.8 1,545.1 824.1 1,097.5 1,278.0 2,369.5 2,652.5 General and administrative 407.3 315.7 863.6 630.3 914.4 1,882.2 2,421.0 3,194.4 4,221.6 5,112.0 Total operating expenses Operating income Interest and other income (expense) 305.8 379.8 838.7 1,605.2 2,604.3 (163.9) 30.8 (591.5) (378.80) 1,226.5 (542.0) 2,062.2 Income before income taxes 141.9 260.5 485.3 Provision for (benefit from) income taxes 19.2 73.8 (73.6) 15.2 195.3 Net income $ 122.6 $ 186.7 $ 558.9 $ 1,211.2 1,866.9 Net income per share: Basic $ 0.29 $ 0.44 $ 1.29 $ 2.78 $ 4.26 0.28 0.43 1.25 2.68 4.13 Diluted Weighted average common shares outstanding (in millions) Basic 425.9 428.8 431.9 435.4 437.8 Diluted 436.5 438.7 446.8 451.2 451.8 EXHIBIT 2 Selected Balance Sheet and Cash Flow Data for Netflix, 2015-2019 (in millions) 2015 2016 2017 2018 2019 Selected Balance Sheet Data Cash and cash equivalents $1,809.3 $ 1,467.6 $ 2.822.8 $ 3,794.5 $ 5,018.4 Current assets 5,431.8 5,720.3 7,670.0 9,694.1 6,178.5 Total current and non-current content assets 7,218.8 14,682.0 20,112.20 20,107.5 $24,504.5 Total assets 10,202.9 13,586.6 19,012.7 25,974.4 33,975.7 Current liabilities 3,529.6 4,586.7 5,466.3 6,487.3 6,855.7 Long-term debe 2,371.4 3,364.3 6,499.4 10,360.1 14,759.3 Stockholders' equity 2,223.4 2,679.8 3,582.0 5,238.8 7.582.2 Cash Flow Data $ (749.4) $(1,474.0) $ (1,785.9) $12,680.5) $ (2,887.3) Net cash (used in) provided by operating activities Net cash provided by (used in) investing activities (179.2) 49.8 34.3 (339.1) (387.1) Net cash provided by (used in) financing activities 1,640.3 1,091.3 3,077.0 4,048.5 4,505.7 TABLE 4.1 Key Financial Ratios: How to Calculate Them and What They Mean Ratio How Calculated What It Shows Profitability ratios 1. Gross profit margin Shows the percentage of revenues available to cover operating expenses and yield a profit Sales revenues - Cost of goods sold Sales revenues Sales revenues - Operating expenses 2. Operating profit margin (or return on sales) Sales revenues or Shows the profitability of current operations without regard to interest charges and income taxes. Earnings before interest and taxes is known as EBIT in financial and business accounting Operating income Sales revenues Profits after taxes Sales revenues Shows after-tax profits per dollar of sales 3. Net profit margin (or net return on sales) 4. Total return on assets 5. Net return on total assets (ROA) Total assets 6. Return on stockholders' equity (ROE) Profits after taxes + Interest A measure of the return on total investment in the Total assets enterprise. Interest is added to after-tax profits to form the numerator, since total assets are financed by creditors as well as by stockholders. Profits after taxes A measure of the return earned by stockholders on the firm's total assets. Profits after taxes The return stockholders are earning on their Total stockholders' equity capital investment in the enterprise. A return in the 12% to 15% range is average. Profits after taxes Long-term debt + Total stockholders'equity earning on the monetary capital invested in the enterprise. A higher return reflects greater bottom-line effectiveness in the use of long-term capital A measure of the return that shareholders are 7. Return on invested capital (ROIC) sometimes referred to as return on capital employed ROCE) (continued) EXHIBIT 1 Netflix's Consolidated Statements of Operations, 2015-2019 (in millions, except per share data) [(g) For tables, all underlines should be the length of the longest numerical entry in each column, which may sometimes vary from column to column; align vertically on $ and ones digits; set end parenthesis to the right of the ones digit and no underline; underlines should be continuous, no breaks for commas or parentheses] 2015 2016 2017 2018 2019 Revenues $6,779.5 $8,830.7 $11,692.7 $15,794.3 $20,156.4 6,257.5 7,659.7 9,967.5 12,440.2 4,59 1.5 2,188.0 2,800.8 4,033.0 5,826.8 7.716.2 Cost of revenues (almost all of which relates to amortization of content assets) Gross profit Operating expenses Technology and development Marketing 650.8 780.2 1,052.8 1,221.8 1,545.1 824.1 1,097.5 1,278.0 2,369.5 2,652.5 General and administrative 407.3 315.7 863.6 630.3 914.4 1,882.2 2,421.0 3,194.4 4,221.6 5,112.0 Total operating expenses Operating income Interest and other income (expense) 305.8 379.8 838.7 1,605.2 2,604.3 (163.9) 30.8 (591.5) (378.80) 1,226.5 (542.0) 2,062.2 Income before income taxes 141.9 260.5 485.3 Provision for (benefit from) income taxes 19.2 73.8 (73.6) 15.2 195.3 Net income $ 122.6 $ 186.7 $ 558.9 $ 1,211.2 1,866.9 Net income per share: Basic $ 0.29 $ 0.44 $ 1.29 $ 2.78 $ 4.26 0.28 0.43 1.25 2.68 4.13 Diluted Weighted average common shares outstanding (in millions) Basic 425.9 428.8 431.9 435.4 437.8 Diluted 436.5 438.7 446.8 451.2 451.8 EXHIBIT 2 Selected Balance Sheet and Cash Flow Data for Netflix, 2015-2019 (in millions) 2015 2016 2017 2018 2019 Selected Balance Sheet Data Cash and cash equivalents $1,809.3 $ 1,467.6 $ 2.822.8 $ 3,794.5 $ 5,018.4 Current assets 5,431.8 5,720.3 7,670.0 9,694.1 6,178.5 Total current and non-current content assets 7,218.8 14,682.0 20,112.20 20,107.5 $24,504.5 Total assets 10,202.9 13,586.6 19,012.7 25,974.4 33,975.7 Current liabilities 3,529.6 4,586.7 5,466.3 6,487.3 6,855.7 Long-term debe 2,371.4 3,364.3 6,499.4 10,360.1 14,759.3 Stockholders' equity 2,223.4 2,679.8 3,582.0 5,238.8 7.582.2 Cash Flow Data $ (749.4) $(1,474.0) $ (1,785.9) $12,680.5) $ (2,887.3) Net cash (used in) provided by operating activities Net cash provided by (used in) investing activities (179.2) 49.8 34.3 (339.1) (387.1) Net cash provided by (used in) financing activities 1,640.3 1,091.3 3,077.0 4,048.5 4,505.7 TABLE 4.1 Key Financial Ratios: How to Calculate Them and What They Mean Ratio How Calculated What It Shows Profitability ratios 1. Gross profit margin Shows the percentage of revenues available to cover operating expenses and yield a profit Sales revenues - Cost of goods sold Sales revenues Sales revenues - Operating expenses 2. Operating profit margin (or return on sales) Sales revenues or Shows the profitability of current operations without regard to interest charges and income taxes. Earnings before interest and taxes is known as EBIT in financial and business accounting Operating income Sales revenues Profits after taxes Sales revenues Shows after-tax profits per dollar of sales 3. Net profit margin (or net return on sales) 4. Total return on assets 5. Net return on total assets (ROA) Total assets 6. Return on stockholders' equity (ROE) Profits after taxes + Interest A measure of the return on total investment in the Total assets enterprise. Interest is added to after-tax profits to form the numerator, since total assets are financed by creditors as well as by stockholders. Profits after taxes A measure of the return earned by stockholders on the firm's total assets. Profits after taxes The return stockholders are earning on their Total stockholders' equity capital investment in the enterprise. A return in the 12% to 15% range is average. Profits after taxes Long-term debt + Total stockholders'equity earning on the monetary capital invested in the enterprise. A higher return reflects greater bottom-line effectiveness in the use of long-term capital A measure of the return that shareholders are 7. Return on invested capital (ROIC) sometimes referred to as return on capital employed ROCE) (continued)