

Answered step by step
Verified Expert Solution
Question
1 Approved Answer
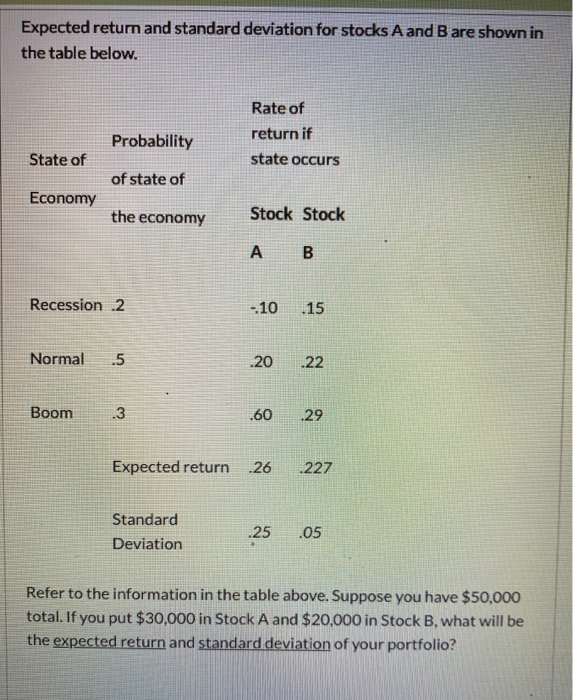
Expected return and standard deviation for stocks A and B are shown in the table below. Probability Rate of return if state occurs State of
Step by Step Solution
There are 3 Steps involved in it
Step: 1

Get Instant Access to Expert-Tailored Solutions
See step-by-step solutions with expert insights and AI powered tools for academic success
Step: 2

Step: 3
Ace Your Homework with AI
Get the answers you need in no time with our AI-driven, step-by-step assistance
Get Started
Public Finance
Authors: Harvey S. Rosen
5th Edition
025617329X, 978-0256173291