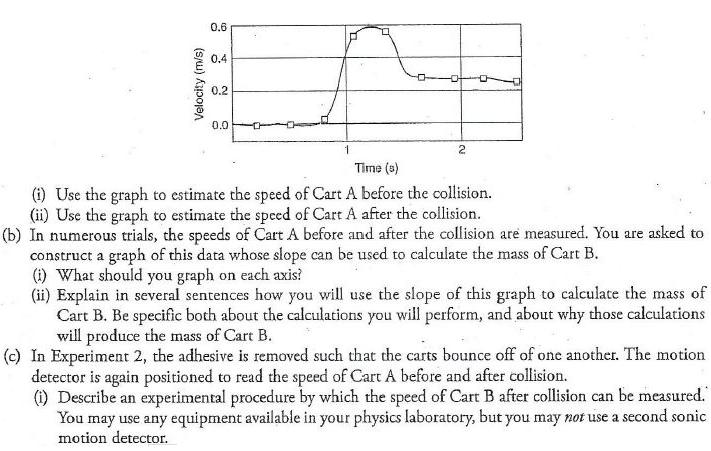
Question: Experimental Analysis Motion detector 500 kg In Experiment 1, two carts collide on a negligible-friction track: Cart A with mass 500 g, and Cart


Experimental Analysis Motion detector 500 kg In Experiment 1, two carts collide on a negligible-friction track: Cart A with mass 500 g, and Cart B with unknown mass. Before the collision, Cart B is at rest. Adhesive is attached to the carts such that after the collision, the carts stick together. The speeds of Cart A before collision and after collision are measured using the sonic motion detector, as shown in the diagram. (a) In one trial, the motion detector is turned on, Cart A is given a shove, the carts collide, and then the detector is turned off. The detector produces the velocity-time graph shown as follows. On the graph, indicate with a circle the portion of the graph that represents the collision occurring. Explain how you figured this out. 0.6 0.4 0.2 0.0 Time (s) (i) Use the graph to estimate the speed of Cart A before the collision. (ii) Use the graph to estimate the speed of Cart A after the collision. (b) In numerous trials, the speeds of Cart A before and after the collision are measured. You are asked to construct a graph of this data whose slope can be used to calculate the mass of Cart B. (1) What should you graph on each axis? (ii) Explain in several sentences how you will use the slope of this graph to calculate the mass of Cart B. Be specific both about the calculations you will perform, and about why those calculations will produce the mass of Cart B. (c) In Experiment 2, the adhesive is removed such that the carts bounce off of one another. The motion detector is again positioned to read the speed of Cart A before and after collision. (i) Describe an experimental procedure by which the speed of Cart B after collision can be measured. You may use any equipment available in your physics laboratory, but you may not use a second sonic motion detector. (su) k1pojen
Step by Step Solution
3.32 Rating (155 Votes )
There are 3 Steps involved in it
Lets break down each part of the question a i Estimate the speed of Cart A before the collision From the velocitytime graph observe the section where ... View full answer

Get step-by-step solutions from verified subject matter experts


