Answered step by step
Verified Expert Solution
Link Copied!

Question

1 Approved Answer

experimental design 1. The data in the table below show the measurements of hemoglobin (grams per 100 ml) in the blood of brown trout. The

experimental design
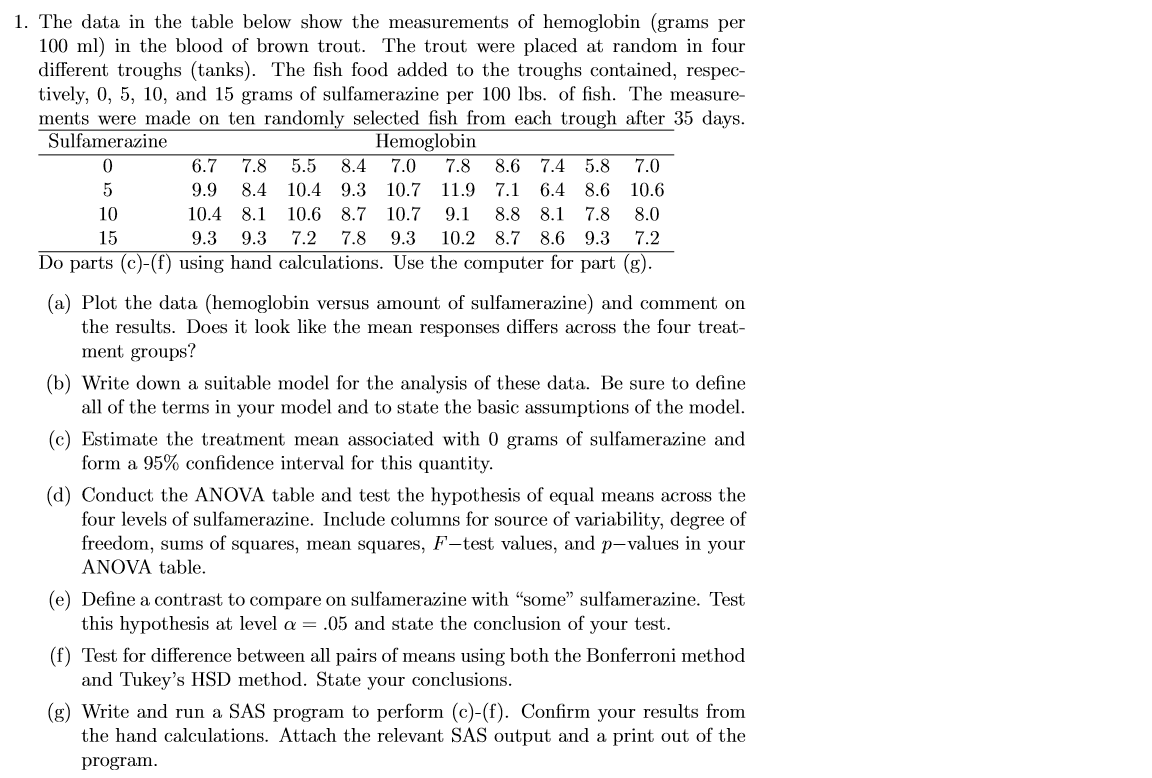
image text in transcribed
1. The data in the table below show the measurements of hemoglobin (grams per 100 ml) in the blood of brown trout. The trout were placed at random in four dierent troughs (tanks). The sh food added to the troughs contained, respec- tively, 0, 5, 10, and 15 grams of sulfamerasine per 100 lbs. of sh. The measure- ments were made on ten randole selected sh from each trough after 35 days. Sulfamerazine Hemoglobin 0 6.7 7.8 5.5 8.4 7.0 7.8 8.6 7.4 5.8 7.0 5 9.9 8.4 10.4 9.3 10.7 11.9 7.1 6.4 8.6 10.6 10 10.4 8.1 10.6 8.7 10.7 9.1 8.8 8.1 7.8 8.0 15 9.3 9.3 7.2 7.8 9.3 10.2 8.7 8.6 9.3 7.2 Do parts (c)(f) using hand calculations. Use the computer for part (g). (a) Plot the data (hemoglobin versus amount of sulfamerazine) and comment on the results. Does it look like the mean responses differs across the four treat- ment groups? (b) Write down a suitable model for the analysis of these data. Be sure to dene all of the terms in your model and to state the basic assumptions of the model. (c) Estimate the treatment mean associated with 0 grams of sulfamerasine and form a 95% condence interval for this quantity. (d) Conduct the ANOVA table and test the hypothesis of equal means across the four levels of sulfamerazine. Include columns for source of variability, degree of freedom, sums of squares, mean squares, Ftast values, and pvalua; in your ANOVA table. (e) Dene a contrast to compare on sulfamerazine with \"some\" sulfamerazine. Test this hypothesis at level or = .05 and state the conclusion of your test. (f) Test for difference between all pairs of means using both the Bonferronj method and Tukey's HSD method. State your conclusions. (g) Write and run a SAS program to perform [c](f). Conrm your results from the hand calculations. Attach the relevant SAS output and a print out of the program

Step by Step Solution

There are 3 Steps involved in it

Step: 1

blur-text-image

Get Instant Access to Expert-Tailored Solutions

See step-by-step solutions with expert insights and AI powered tools for academic success

Step: 2

blur-text-image

Step: 3

blur-text-image

Ace Your Homework with AI

Get the answers you need in no time with our AI-driven, step-by-step assistance

Get Started

Recommended Textbook for

Schaums Easy Outline College Algebra

Authors: Murray Spiegel ,Robert Moyer

1st Edition

0070527091, 978-0070527096

More Books

Students also viewed these Mathematics questions