Answered step by step
Verified Expert Solution
Question
1 Approved Answer
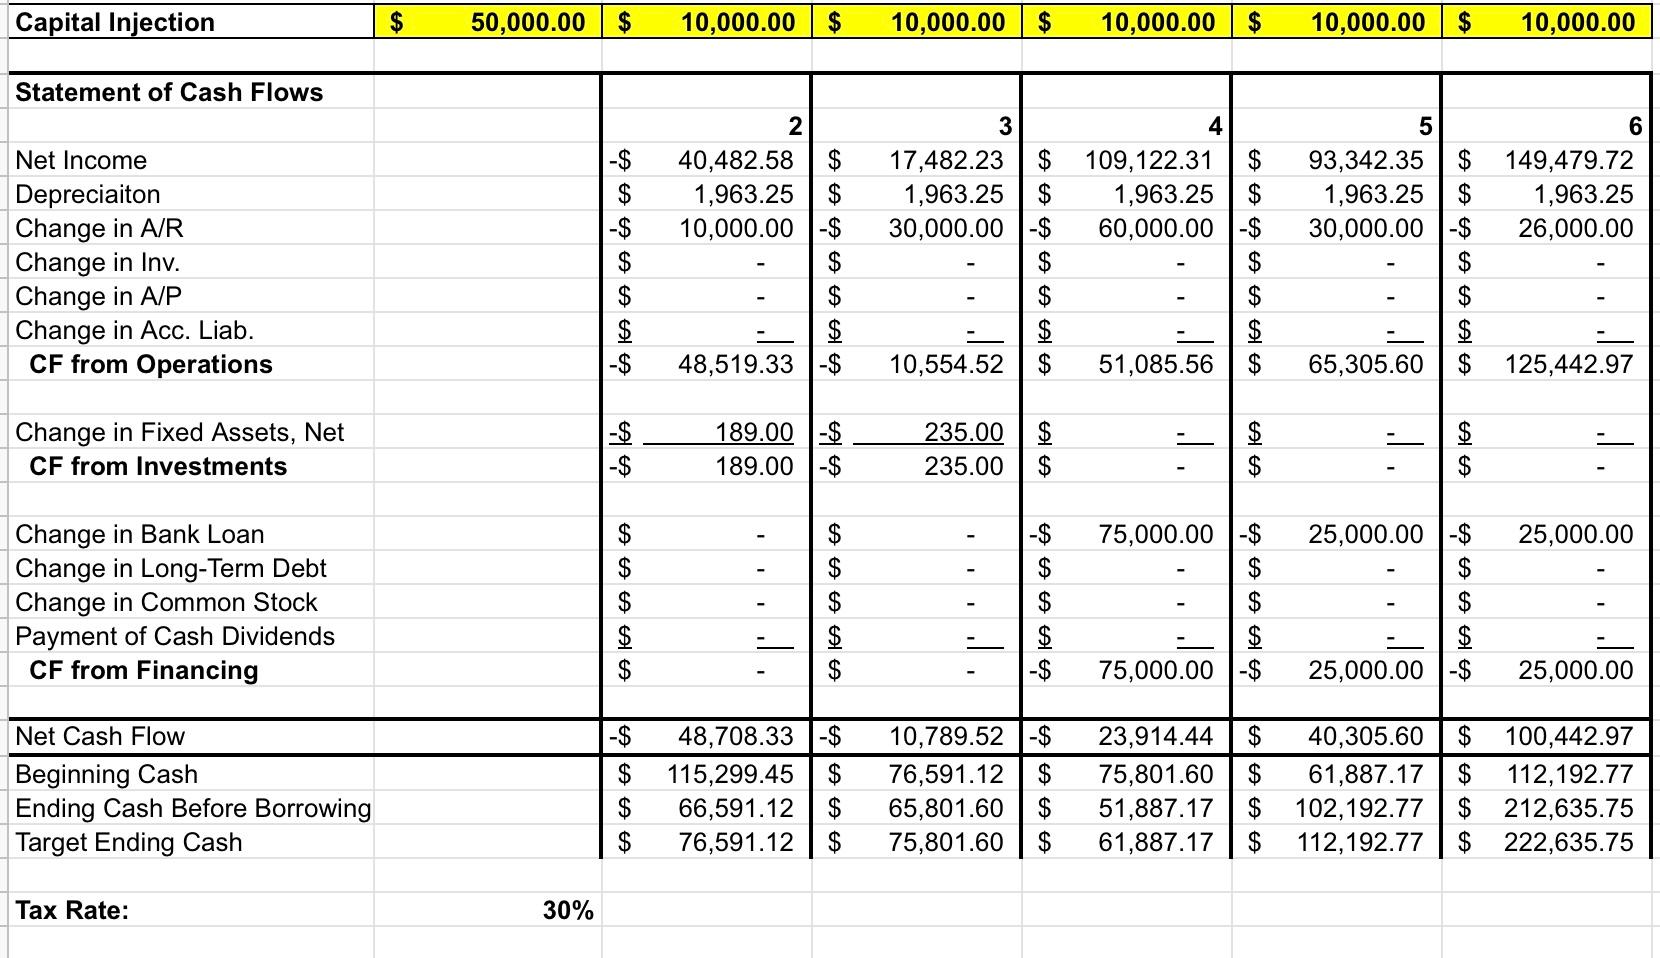
Explain if the business is making profit or what can the business do better according to these financial data. Please explain a bit long Capital


Explain if the business is making profit or what can the business do better according to these financial data. Please explain a bit long
Capital Injection $ 50,000.00 $ 10,000.00 $ 10,000.00 $ 10,000.00 $ 10,000.00 $ 10,000.00 Statement of Cash Flows 2 40,482.58$ 1,963.25 10,000.00 -$ 3 17,482.23 1,963.25 30,000.00 $ 4 109,122.31 1,963.25 60,000.00 $ 6 149,479.72 1,963.25 26,000.00 Net Income Depreciaiton Change in AIR Change in Inv. Change in A/P Change in Acc. Liab. CF from Operations -$ ? 5 93,342.35 1,963.25 30,000.00 $ $ ? $ $ $ -$ 48,519.33 10,554.52 $ 51,085.56 65,305.60 125,442.97 Change in Fixed Assets, Net CF from Investments $ 189.00 $ 189.00 -$ ? 235.00 235.00 $ $ $ -$ 75,000.00 $ 25,000.00 Change in Bank Loan Change in Long-Term Debt Change in Common Stock Payment of Cash Dividends CF from Financing 25,000.00 $ $ $ $ 25,000.00 - $ ? $ I $ $ $ -$ $ 75,000.00 $ 25,000.00 -$ l -$ Net Cash Flow Beginning Cash Ending Cash Before Borrowing Target Ending Cash 48,708.33 -$ 115,299.45$ 66,591.12 $ 76,591.12 $ $ $ $ [ 10,789.52 76,591.12 65,801.60 75,801.60 l 23,914.44 $ 75,801.60 $ 51,887.17 $ 61,887.17 $ $ $ $ 40,305.60 61,887.17 102,192.77 112,192.77 ]l $ 100,442.97 $ 112,192.77 $ 212,635.75 $ 222,635.75 05 06 Tax Rate: 30% Growth >>> 500% 300% 150% 30% 20% Income Statements Year 1 N 3 4 5 6 -$ Revenue Variable Expense Fixed Expenses Depreciaton EBT Taxes Net Income $12,325.40 $ 3,800.00-$ 81,446.44 $ 1,963.25 -$ 74,884.29 -$ $ 74,884.29 $ 73,952.40 $ 22,800.00 $ 89,671.73 -$ 1,963.25 -$ 40,482.58 -$ 40,482.58 $ 295,809.60 $ 739,524.00 $ 91,200.00 $ 228,000.00 $ 177,671.73 $ 353,671.73 $ 1,963.25 $ 1,963.25 -$ 24,974.62 155,889.02 7,492.39 $ 46,766.71 $ 17,482.23 $ 109,122.31 $ 961,381.20 $ 1,153,657.44 296,400.00 - $ 355,680.00 529,671.73 -$ 582,471.73 1,963.25 -$ 1,963.25 133,346.22 $ 213,542.46 40,003.87 -$ 64,062.74 93,342.35 $ 149,479.72 $ Cash Dividends Added Retained Earnings AA $ $ -$ 74,884.29 $ 40,482.58 $ 17,482.23 $ 109,122.31 93,342.35 $ 149,479.72 Capital Injection $ 50,000.00 $ 10,000.00 $ 10,000.00 $ 10,000.00 $ 10,000.00 $ 10,000.00 Statement of Cash Flows 2 40,482.58$ 1,963.25 10,000.00 -$ 3 17,482.23 1,963.25 30,000.00 $ 4 109,122.31 1,963.25 60,000.00 $ 6 149,479.72 1,963.25 26,000.00 Net Income Depreciaiton Change in AIR Change in Inv. Change in A/P Change in Acc. Liab. CF from Operations -$ ? 5 93,342.35 1,963.25 30,000.00 $ $ ? $ $ $ -$ 48,519.33 10,554.52 $ 51,085.56 65,305.60 125,442.97 Change in Fixed Assets, Net CF from Investments $ 189.00 $ 189.00 -$ ? 235.00 235.00 $ $ $ -$ 75,000.00 $ 25,000.00 Change in Bank Loan Change in Long-Term Debt Change in Common Stock Payment of Cash Dividends CF from Financing 25,000.00 $ $ $ $ 25,000.00 - $ ? $ I $ $ $ -$ $ 75,000.00 $ 25,000.00 -$ l -$ Net Cash Flow Beginning Cash Ending Cash Before Borrowing Target Ending Cash 48,708.33 -$ 115,299.45$ 66,591.12 $ 76,591.12 $ $ $ $ [ 10,789.52 76,591.12 65,801.60 75,801.60 l 23,914.44 $ 75,801.60 $ 51,887.17 $ 61,887.17 $ $ $ $ 40,305.60 61,887.17 102,192.77 112,192.77 ]l $ 100,442.97 $ 112,192.77 $ 212,635.75 $ 222,635.75 05 06 Tax Rate: 30% Growth >>> 500% 300% 150% 30% 20% Income Statements Year 1 N 3 4 5 6 -$ Revenue Variable Expense Fixed Expenses Depreciaton EBT Taxes Net Income $12,325.40 $ 3,800.00-$ 81,446.44 $ 1,963.25 -$ 74,884.29 -$ $ 74,884.29 $ 73,952.40 $ 22,800.00 $ 89,671.73 -$ 1,963.25 -$ 40,482.58 -$ 40,482.58 $ 295,809.60 $ 739,524.00 $ 91,200.00 $ 228,000.00 $ 177,671.73 $ 353,671.73 $ 1,963.25 $ 1,963.25 -$ 24,974.62 155,889.02 7,492.39 $ 46,766.71 $ 17,482.23 $ 109,122.31 $ 961,381.20 $ 1,153,657.44 296,400.00 - $ 355,680.00 529,671.73 -$ 582,471.73 1,963.25 -$ 1,963.25 133,346.22 $ 213,542.46 40,003.87 -$ 64,062.74 93,342.35 $ 149,479.72 $ Cash Dividends Added Retained Earnings AA $ $ -$ 74,884.29 $ 40,482.58 $ 17,482.23 $ 109,122.31 93,342.35 $ 149,479.72Step by Step Solution
There are 3 Steps involved in it
Step: 1

Get Instant Access to Expert-Tailored Solutions
See step-by-step solutions with expert insights and AI powered tools for academic success
Step: 2

Step: 3

Ace Your Homework with AI
Get the answers you need in no time with our AI-driven, step-by-step assistance
Get Started


