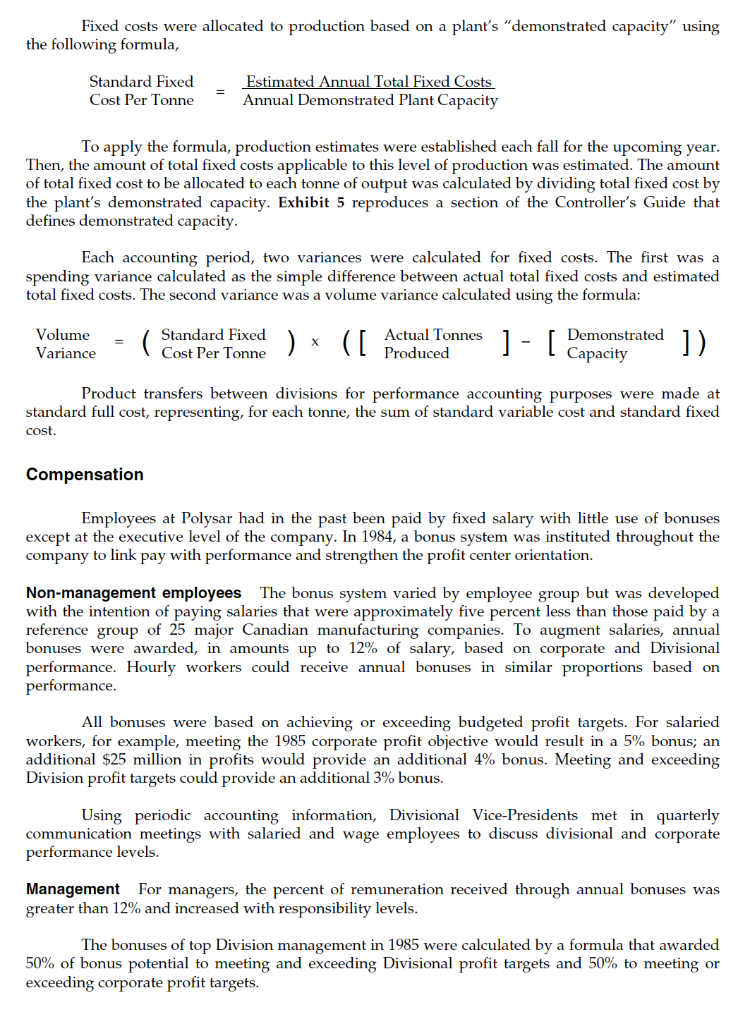
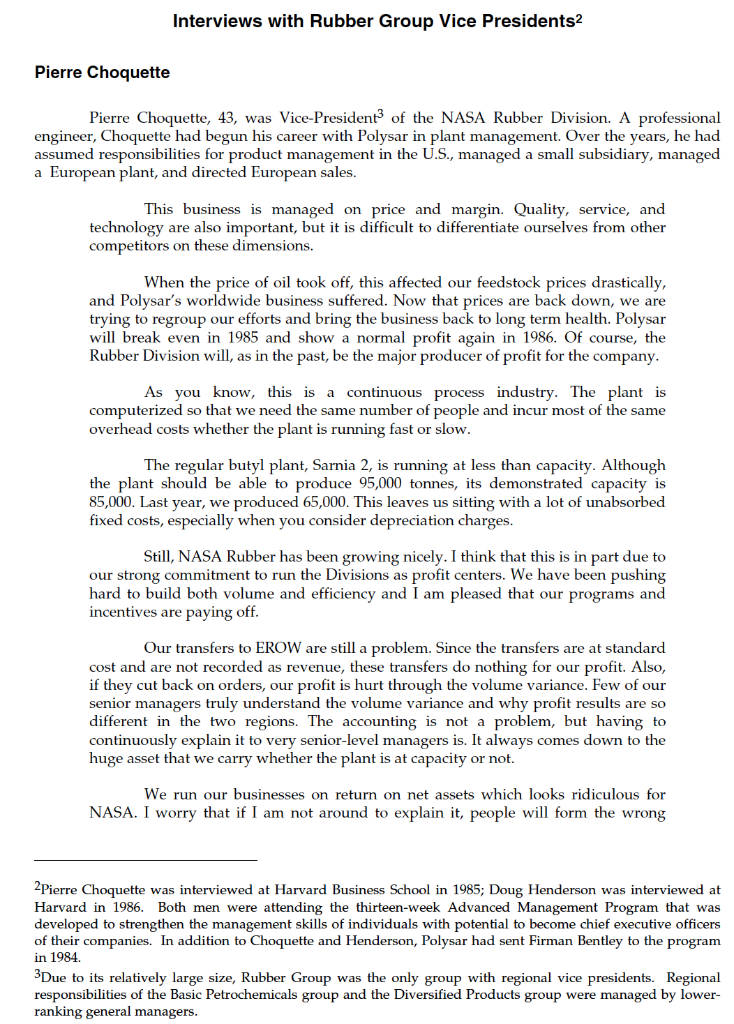
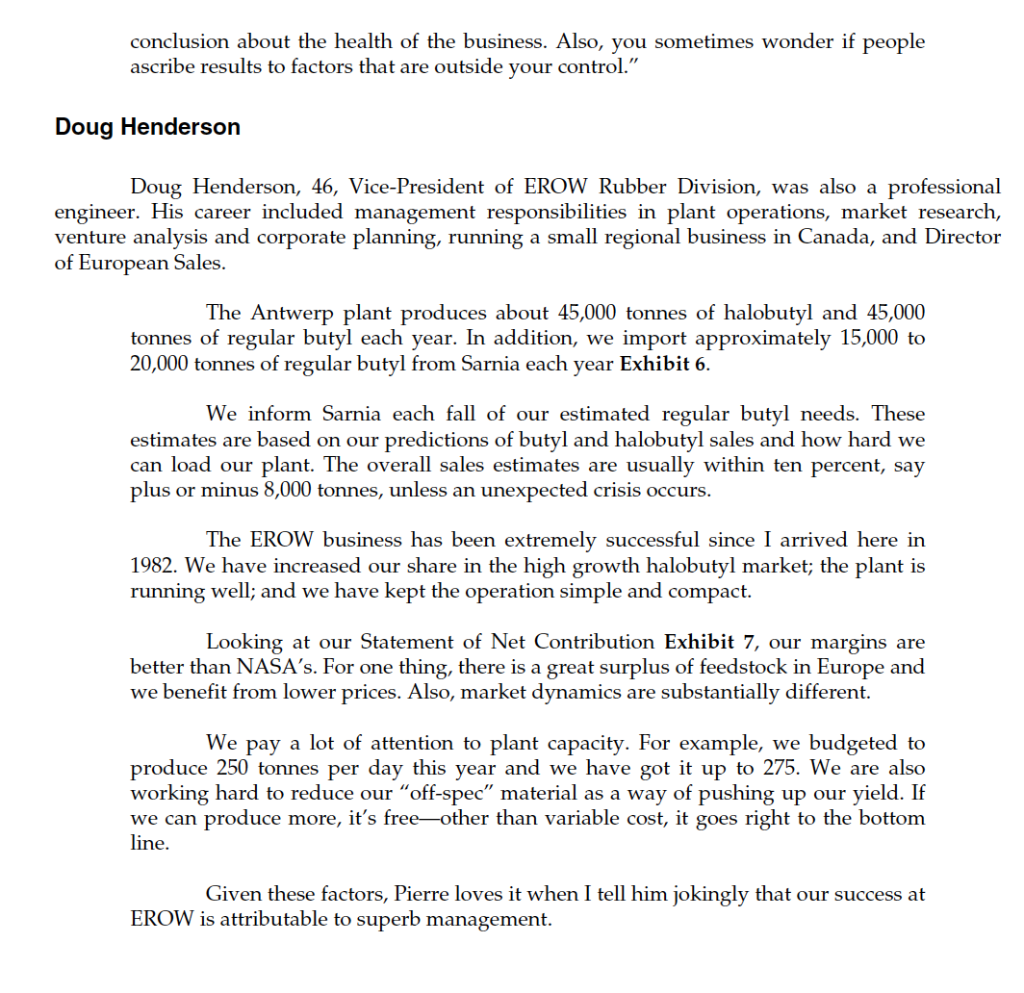
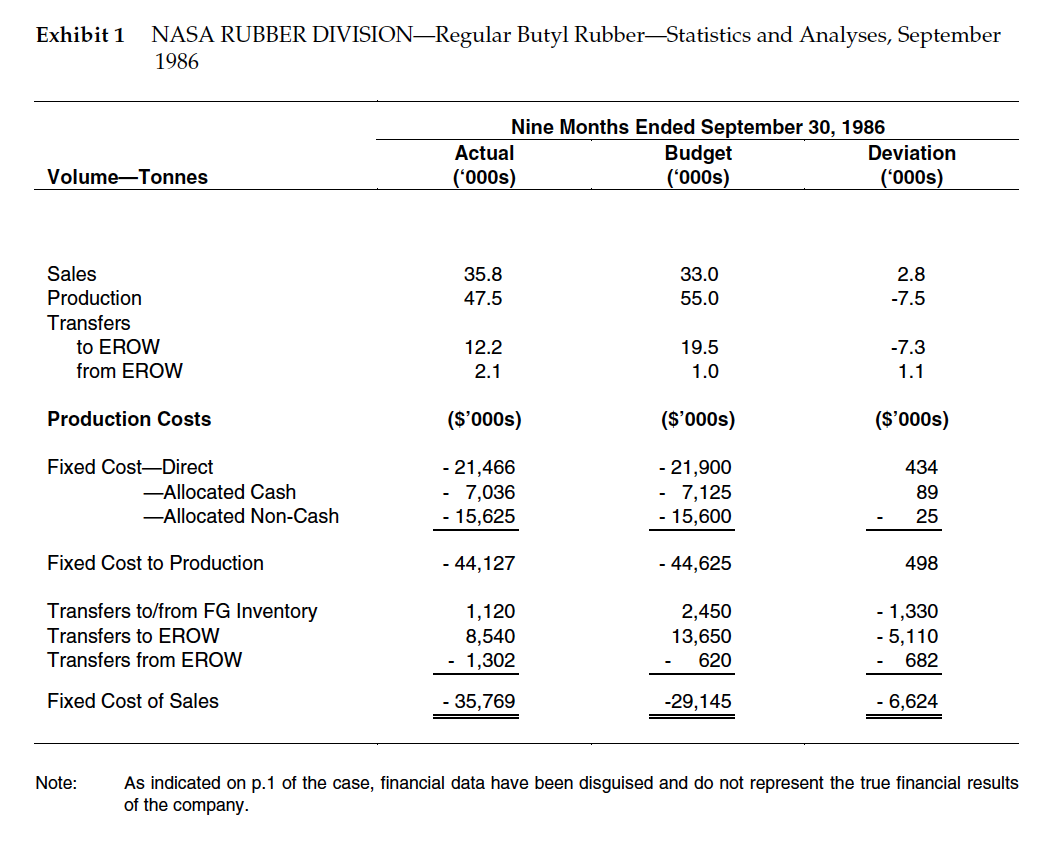
EXPLAIN: What benefits, if any, does Polysar gain by allocating its overheads on the basis of "Demonstrated Capacity"?
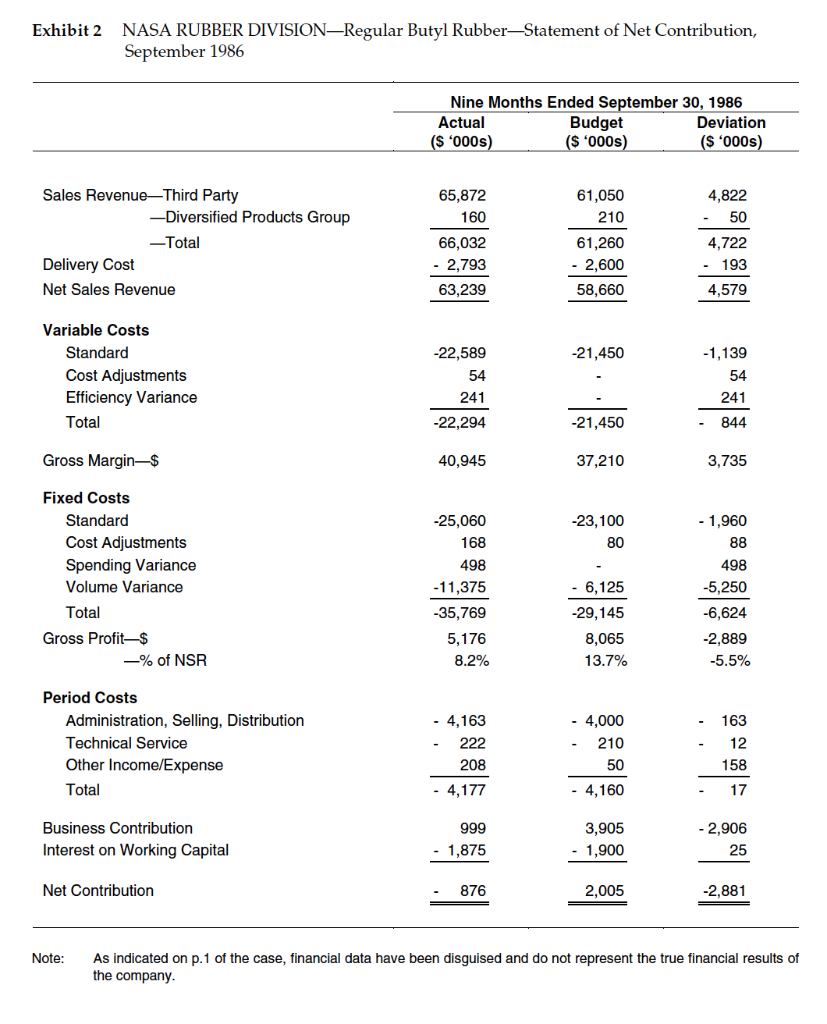
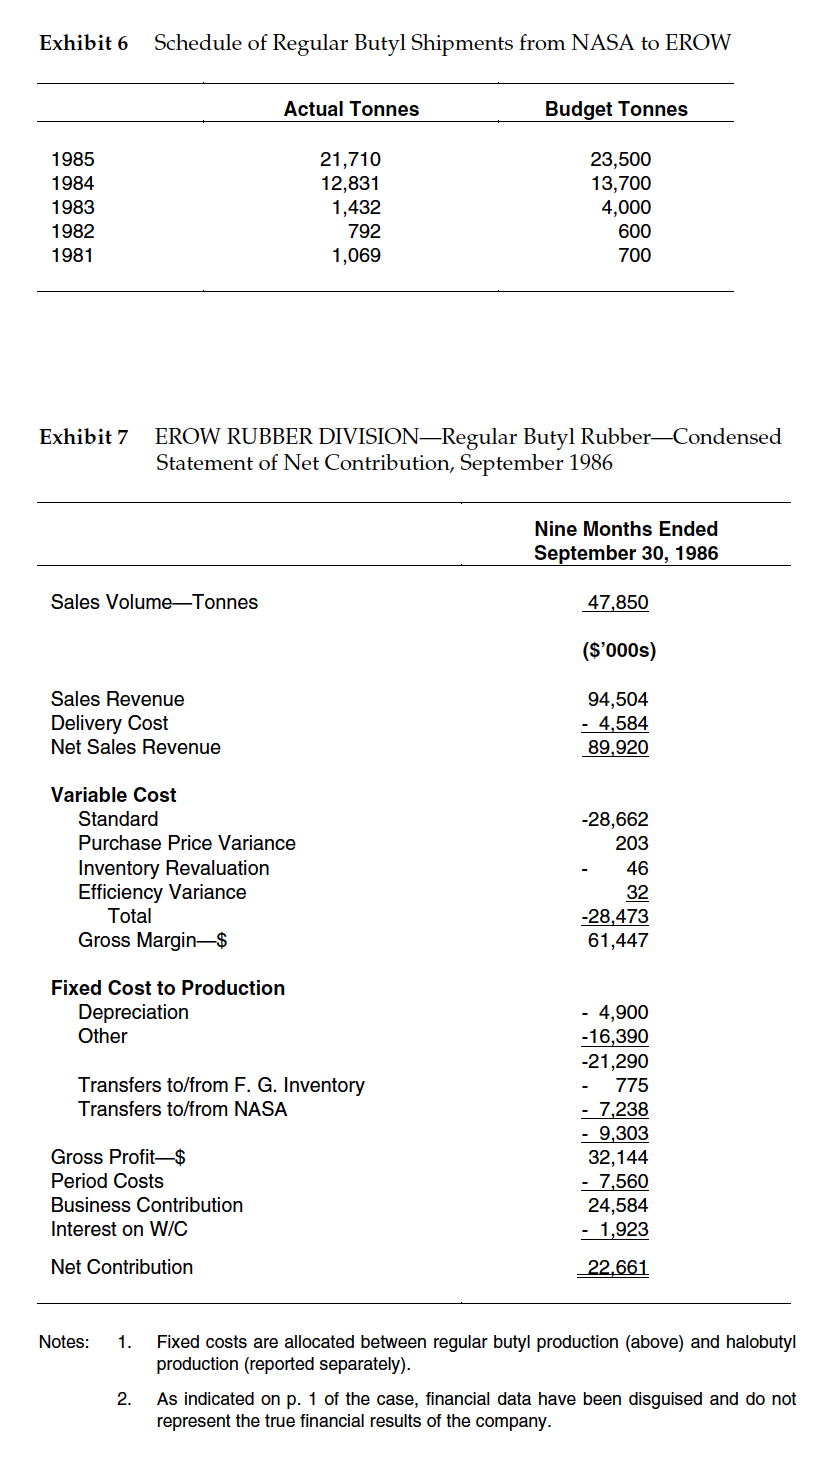
war against the United States by Japan in December 1941. During 1942 and 1943, ten synthetic rubber plants were built by the Governments of the United States and Canada including the Polysar plant in Sarnia. After the war, the supply of natural rubber was again secure and the nine U.S. plants were sold to private industry or closed. Polysar remained in operation as a Crown Corporation, wholly owned by the Government of Canada. In 1972, by an Act of Parliament, the Canada Development Corporation (CDC) was created as a government-owned, venture capital company to encourage Canadian business development; at that time, the equity shares of Polysar were transferred to the Canada Development Corporation. In 1986, Polysar remained wholly-owned by the CDC; however, in a government sponsored move to privatization, the majority of the shares of the CDC were sold to the Canadian public in the period 1982 to 1985. Through acquisition and internal growth, Polysar had grown considerably from its original single plant. Polysar now employed 6,650 people including 3,100 in Canada, 1,050 in the U.S., and 2,500 in Europe and elsewhere. The company operated 20 manufacturing plants in Canada, United States, Belgium, France, The Netherlands, and West Germany. Structure The operations of the company were structured into three groups: basic petrochemicals, rubber, and diversified products (Exhibit 3). Basic Petrochemicals Firman Bentley, 51, was Group Vice-President of Basic Petrochemicals. This business unit produced primary petrochemicals such as ethylene as well as intermediate products such as propylene, butadiene, and styrene monomers. Group sales in 1985 were approximately $800 million of which $500 million was sold to outside customers and the remainder was sold as intermediate feedstock to Polysar's downstream operations. Rubber The Rubber Group was headed by Charles Ambridge, 61, Group Vice-President. Polysar held 9% of the world synthetic rubber market (excluding communist bloc countries). As the largest Group in the company, Rubber Group produced 46% of Polysar sales. Major competitors included Goodyear, Bayer, Exxon, and Dupont. Rubber products, such as butyl and halobutyl, were sold primarily to manufacturers of automobile tires (six of the world's largest tire companies accounted for 70% of the world butyl and halobutyl demand); other uses included belting, footwear, adhesives, hose, seals, plastics modification, and chewing gum. The Rubber Group was split into two operating divisions that were managed as profit centers: NASA (North and South America) and EROW (Europe and rest of world). In addition to the two operating profit centers, the Rubber Group included a Global Marketing Department and a Research Division. The costs of these departments were not charged to the two operating profit centers, but instead were charged against Group profits. Diversified Products John Beaton, 48, was Vice-President of Diversified Products, a group that consisted of the Latex, Plastics, and Specialty Products Divisions. This group was composed of high technology product categories that were expected to double sales within five years. In 1985, the group provided 27% of Polysar's sales revenue. Bentley, Ambridge, and Beaton reported to Robert Dudley, 60, President and Chief Executive Officer. Rubber Group A key component of Polysar's strategy was to be a leader in high margin, specialty rubbers. The leading products in this category were the butyl and halobutyl rubbers. Attributes of butyl rubber include low permeability to gas and moisture, resistance to steam and weathering, high energy absorption, and chemical resistance. Butyl rubber was traditionally used in inner tubes and general purpose applications. Halobutyl rubber, a modified derivative, possesses the same attributes as regular butyl with additional properties that allow bonding to other materials. Thus, halobutyls were used extensively as liners and sidewalls in tubeless tires. Butyl and halobutyl rubber were manufactured from feedstocks such as crude oil, naphtha, butane, propane, and ethane (Exhibit 4). Polysar manufactured butyl rubbers at two locations: NASA Division's Sarnia plant and EROW Division's Antwerp plant. NASA Butyl Plant The original Sarnia plant, built in 1942, manufactured regular butyl until 1972. At that time, market studies predicted rapid growth in the demand for high-quality radial tires manufactured with halobutyl. Demand for regular butyl was predicted to remain steady since poor road conditions in many countries of the world necessitated the use of tires with inner tubes. In 1972, the Sarnia plant was converted to allow production of halobutyls as well as regular butyl. By the 1980s, demand for halobutyl had increased to the point that Polysar forecast capacity constraints. During 1983 and 1984, the company built a second plant at Sarnia, known as Sarnia 2, to produce regular butyl. The original plant, Sarnia 1, was then dedicated solely to the production of halobutyl. Sarnia 2, with a capital cost of $550 million, began full operations late in 1984. Its annual nameplate (i.e., design) production capacity for regular butyl was 95,000 tonnes. During 1985, the plant produced 65,000 tonnes. EROW Butyl Plant The EROW Division's butyl plant was located in Antwerp, Belgium. Built in 1964 as a regular butyl unit, the plant was modified in 1979/80 to allow it to produce halobutyl as well as regular butyl. The annual nameplate production capacity of the Antwerp plant was 90,000 tonnes. In 1985, as in previous years, the plant operated near or at its nameplate capacity. The Antwerp plant was operated to meet fully the halobutyl demand of EROW customers, the remainder of capacity was used to produce regular butyl. In 1981, the plant's output was 75% regular butyl and 25% halobutyl; by 1985, halobutyl represented 50% of the plant's production. Since regular butyl demand outpaced the plant's remaining capacity, EROW took its regular butyl shortfall from the Sarnia 2 plant; in 1985, 21,000 tonnes of regular butyl were shipped from NASA to EROW. Product Scheduling Although NASA served customers in North and South America and EROW serviced customers in Europe and the rest of the world, regular butyl could be shipped from either the Sarnia 2 or Antwerp plant. NASA shipped approximately one-third of its regular butyl output to EROW. Also, customers located in distant locations could receive shipments from either plant due to certain cost or logistical advantages. For example, Antwerp sometimes shipped to Brazil and Sarnia sometimes shipped to the Far East. A Global Marketing Department worked with Regional Directors of Marketing and Regional Product Managers to coordinate product flows. Three sets of factors influenced these analyses. First, certain customers demanded products from a specific plant due to slight product differences resulting from the type of feedstock used and the plant configuration. Second, costs varied between Sarnia and Antwerp due to differences in variable costs (primarily feedstock and energy), shipping, and currency rates. Finally, inventory levels, production interruptions, and planned shutdowns were considered. In September and October of each year, NASA and EROW divisions prepared production estimates for the upcoming year. These estimates were based on estimated sales volumes and plant loadings (i.e., capacity utilization). Since the Antwerp plant operated at capacity, the planning exercise was largely for the benefit of the managers of the Sarnia 2 plant who needed to know how much regular butyl Antwerp would need from the Sarnia 2 plant. Product Costing and Transfer Prices Butyl rubbers were costed using standard rates for variable and fixed costs. Variable costs included feedstocks, chemicals, and energy. Standard variable cost per tonne of butyl was calculated by multiplying a standard utilization factor (i.e. the standard quantity of inputs used) by a standard price established for each unit of input. Since feedstock prices varied with worldwide market conditions and represented the largest component of costs, it was impossible to establish standard input prices that remained valid for extended periods. Therefore, the company reset feedstock standard costs each month to a price that reflected market prices. Chemical and energy standard costs were established annually. A purchase price variance (were input prices above or below standard prices?) and an efficiency variance (did production require more or less inputs than standard?) were calculated for variable costs each accounting period. Fixed costs comprised three categories of cost. Direct costs included direct labor, maintenance, chemicals required to keep the plant bubbling, and fixed utilities. Allocated cash costs included plant management, purchasing department costs, engineering, planning, and accounting. Allocated non-cash costs represented primarily depreciation. Fixed costs were allocated to production based on a plant's "demonstrated capacity" using the following formula, Standard Fixed Cost Per Tonne Estimated Annual Total Fixed Costs Annual Demonstrated Plant Capacity To apply the formula, production estimates were established each fall for the upcoming year. Then, the amount of total fixed costs applicable to this level of production was estimated. The amount of total fixed cost to be allocated to each tonne of output was calculated by dividing total fixed cost by the plant's demonstrated capacity. Exhibit 5 reproduces a section of the Controller's Guide that defines demonstrated capacity. Each accounting period, two variances were calculated for fixed costs. The first was a spending variance calculated as the simple difference between actual total fixed costs and estimated total fixed costs. The second variance was a volume variance calculated using the formula: = Volume Variance Standard Fixed Cost Per Tonne ). X ( [ Actual Tonnes ] - [ Demonstrated Capacity ]). Product transfers between divisions for performance accounting purposes were made at standard full cost, representing, for each tonne, the sum of standard variable cost and standard fixed cost. Compensation Employees at Polysar had in the past been paid by fixed salary with little use of bonuses except at the executive level of the company. In 1984, a bonus system was instituted throughout the company to link pay with performance and strengthen the profit center orientation. Non-management employees The bonus system varied by employee group but was developed with the intention of paying salaries that were approximately five percent less than those paid by a reference group of 25 major Canadian manufacturing companies. To augment salaries, annual bonuses were awarded, in amounts up to 12% of salary, based on corporate and Divisional performance. Hourly workers could receive annual bonuses in similar proportions based on performance. All bonuses were based on achieving or exceeding budgeted profit targets. For salaried workers, for example, meeting the 1985 corporate profit objective would result in a 5% bonus; an additional $25 million in profits would provide an additional 4% bonus. Meeting and exceeding Division profit targets could provide an additional 3% bonus. Using periodic accounting information, Divisional Vice-Presidents met in quarterly communication meetings with salaried and wage employees to discuss divisional and corporate performance levels. Management For managers, the percent of remuneration received through annual bonuses was greater than 12% and increased with responsibility levels. The bonuses of top Division management in 1985 were calculated by a formula that awarded 50% of bonus potential to meeting and exceeding Divisional profit targets and 50% to meeting or exceeding corporate profit targets. Interviews with Rubber Group Vice Presidents Pierre Choquette Pierre Choquette, 43, was Vice-President of the NASA Rubber Division. A professional engineer, Choquette had begun his career with Polysar in plant management. Over the years, he had assumed responsibilities for product management in the U.S., managed a small subsidiary, managed a European plant, and directed European sales. This business is managed on price and margin. Quality, service, and technology are also important, but it is difficult to differentiate ourselves from other competitors on these dimensions. When the price of oil took off, this affected our feedstock prices drastically, and Polysar's worldwide business suffered. Now that prices are back down, we are trying to regroup our efforts and bring the business back to long term health. Polysar will break even in 1985 and show a normal profit again in 1986. Of course, the Rubber Division will, as in the past, be the major producer of profit for the company. As you know, this is a continuous process industry. The plant is computerized so that we need the same number of people and incur most of the same overhead costs whether the plant is running fast or slow. The regular butyl plant, Sarnia 2, is running at less than capacity. Although the plant should be able to produce 95,000 tonnes, its demonstrated capacity is 85,000. Last year, we produced 65,000. This leaves us sitting with a lot of unabsorbed fixed costs, especially when you consider depreciation charges. Still, NASA Rubber has been growing nicely. I think that this is in part due to our strong commitment to run the Divisions as profit centers. We have been pushing hard to build both volume and efficiency and I am pleased that our programs and incentives are paying off. Our transfers to EROW are still a problem. Since the transfers are at standard cost and are not recorded as revenue, these transfers do nothing for our profit. Also, if they cut back on orders, our profit is hurt through the volume variance. Few of our senior managers truly understand the volume variance and why profit results are so different in the two regions. The accounting is not a problem, but having to continuously explain it to very senior-level managers is. It always comes down to the huge asset that we carry whether the plant is at capacity or not. We run our businesses on return on net assets which looks ridiculous for NASA. I worry that if I am not around to explain it, people will form the wrong 2 Pierre Choquette was interviewed at Harvard Business School in 1985; Doug Henderson was interviewed at Harvard in 1986. Both men were attending the thirteen-week Advanced Management Program that was developed to strengthen the management skills of individuals with potential to become chief executive officers of their companies. In addition to Choquette and Henderson, Polysar had sent Firman Bentley to the program in 1984. 3Due to its relatively large size, Rubber Group was the only group with regional vice presidents. Regional responsibilities of the Basic Petrochemicals group and the Diversified Products group were managed by lower- ranking general managers. conclusion about the health of the business. Also, you sometimes wonder if people ascribe results to factors that are outside your control." Doug Henderson Doug Henderson, 46, Vice-President of EROW Rubber Division, was also a professional engineer. His career included management responsibilities in plant operations, market research, venture analysis and corporate planning, running a small regional business in Canada, and Director of European Sales. The Antwerp plant produces about 45,000 tonnes of halobutyl and 45,000 tonnes of regular butyl each year. In addition, we import approximately 15,000 to 20,000 tonnes of regular butyl from Sarnia each year Exhibit 6. We inform Sarnia each fall of our estimated regular butyl needs. These estimates are based on our predictions of butyl and halobutyl sales and how hard we can load our plant. The overall sales estimates are usually within ten percent, say plus or minus 8,000 tonnes, unless an unexpected crisis occurs. The EROW business has been extremely successful since I arrived here in 1982. We have increased our share in the high growth halobutyl market; the plant is running well; and we have kept the operation simple and compact. Looking at our Statement of Net Contribution Exhibit 7, our margins are better than NASA's. For one thing, there is a great surplus of feedstock in Europe and we benefit from lower prices. Also, market dynamics are substantially different. We pay a lot of attention to plant capacity. For example, we budgeted to produce 250 tonnes per day this year and we have got it up to 275. We are also working hard to reduce our off-spec" material as a way of pushing up our yield. If we can produce more, it's freeother than variable cost, it goes right to the bottom line. Given these factors, Pierre loves it when I tell him jokingly that our success at EROW is attributable to superb management. Exhibit 1 NASA RUBBER DIVISIONRegular Butyl RubberStatistics and Analyses, September 1986 Nine Months Ended September 30, 1986 Actual Budget Deviation (*000s) ("000s) (*000s) Volume-Tonnes 35.8 47.5 33.0 55.0 2.8 -7.5 Sales Production Transfers to EROW from EROW 12.2 2.1 19.5 1.0 -7.3 1.1 Production Costs ($'000s) ($'000s) ($'000s) Fixed Cost-Direct -Allocated Cash -Allocated Non-Cash - 21,466 7,036 - 15,625 - 21,900 - 7,125 - 15,600 434 89 25 Fixed Cost to Production - 44,127 - 44,625 498 Transfers to/from FG Inventory Transfers to EROW Transfers from EROW 1,120 8,540 - 1,302 2,450 13,650 620 - 1,330 -5,110 682 Fixed Cost of Sales - 35,769 -29,145 - 6,624 Note: As indicated on p. 1 of the case, financial data have been disguised and do not represent the true financial results of the company. Exhibit 2 NASA RUBBER DIVISIONRegular Butyl Rubber-Statement of Net Contribution, September 1986 Nine Months Ended September 30, 1986 Actual Budget Deviation ($ '000s) ($ '000s) ($ '000s) 65,872 61,050 210 160 Sales Revenue-Third Party -Diversified Products Group -Total Delivery Cost Net Sales Revenue 4,822 50 4,722 66,032 - 2,793 63,239 61,260 - 2,600 58,660 193 4,579 -21,450 Variable Costs Standard Cost Adjustments Efficiency Variance Total -22,589 54 241 -22,294 -1,139 54 241 -21,450 844 Gross Margin-$ 40,945 37,210 3,735 - 1,960 -25,060 168 -23,100 80 88 498 Fixed Costs Standard Cost Adjustments Spending Variance Volume Variance Total Gross Profit-$ -% of NSR 498 -5,250 -11,375 -35,769 6,125 -29, 145 8,065 13.7% 5,176 8.2% -6,624 -2,889 -5.5% 163 Period Costs Administration, Selling, Distribution Technical Service Other Income/Expense Total - 4,163 - 222 208 - 4,177 - 4,000 - 210 50 - 4,160 12 158 17 999 Business Contribution Interest on Working Capital 3,905 - 1,900 - 2,906 25 - 1,875 Net Contribution 876 2,005 -2,881 Note: As indicated on p. 1 of the case, financial data have been disguised and do not represent the true financial results of the company. Exhibit 6 Schedule of Regular Butyl Shipments from NASA to EROW Actual Tonnes Budget Tonnes 1985 1984 1983 1982 1981 21,710 12,831 1,432 792 1,069 23,500 13,700 4,000 600 700 Exhibit 7 EROW RUBBER DIVISIONRegular Butyl Rubber-Condensed Statement of Net Contribution, September 1986 Nine Months Ended September 30, 1986 Sales VolumeTonnes 47,850 ($'000s) Sales Revenue Delivery Cost Net Sales Revenue 94,504 - 4,584 89,920 Variable Cost Standard Purchase Price Variance Inventory Revaluation Efficiency Variance Total Gross Margin-$ -28,662 203 46 32 -28,473 61,447 Fixed Cost to Production Depreciation Other Transfers to/from F. G. Inventory Transfers to/from NASA - 4,900 -16,390 -21,290 - 775 - 7.238 - 9,303 32,144 - 7,560 24,584 - 1,923 Gross Profit-$ Period Costs Business Contribution Interest on W/C /C Net Contribution 22.661 Notes: 1. Fixed costs are allocated between regular butyl production (above) and halobutyl production (reported separately). As indicated on p. 1 of the case, financial data have been disguised and do not represent the true financial results of the company. 2. war against the United States by Japan in December 1941. During 1942 and 1943, ten synthetic rubber plants were built by the Governments of the United States and Canada including the Polysar plant in Sarnia. After the war, the supply of natural rubber was again secure and the nine U.S. plants were sold to private industry or closed. Polysar remained in operation as a Crown Corporation, wholly owned by the Government of Canada. In 1972, by an Act of Parliament, the Canada Development Corporation (CDC) was created as a government-owned, venture capital company to encourage Canadian business development; at that time, the equity shares of Polysar were transferred to the Canada Development Corporation. In 1986, Polysar remained wholly-owned by the CDC; however, in a government sponsored move to privatization, the majority of the shares of the CDC were sold to the Canadian public in the period 1982 to 1985. Through acquisition and internal growth, Polysar had grown considerably from its original single plant. Polysar now employed 6,650 people including 3,100 in Canada, 1,050 in the U.S., and 2,500 in Europe and elsewhere. The company operated 20 manufacturing plants in Canada, United States, Belgium, France, The Netherlands, and West Germany. Structure The operations of the company were structured into three groups: basic petrochemicals, rubber, and diversified products (Exhibit 3). Basic Petrochemicals Firman Bentley, 51, was Group Vice-President of Basic Petrochemicals. This business unit produced primary petrochemicals such as ethylene as well as intermediate products such as propylene, butadiene, and styrene monomers. Group sales in 1985 were approximately $800 million of which $500 million was sold to outside customers and the remainder was sold as intermediate feedstock to Polysar's downstream operations. Rubber The Rubber Group was headed by Charles Ambridge, 61, Group Vice-President. Polysar held 9% of the world synthetic rubber market (excluding communist bloc countries). As the largest Group in the company, Rubber Group produced 46% of Polysar sales. Major competitors included Goodyear, Bayer, Exxon, and Dupont. Rubber products, such as butyl and halobutyl, were sold primarily to manufacturers of automobile tires (six of the world's largest tire companies accounted for 70% of the world butyl and halobutyl demand); other uses included belting, footwear, adhesives, hose, seals, plastics modification, and chewing gum. The Rubber Group was split into two operating divisions that were managed as profit centers: NASA (North and South America) and EROW (Europe and rest of world). In addition to the two operating profit centers, the Rubber Group included a Global Marketing Department and a Research Division. The costs of these departments were not charged to the two operating profit centers, but instead were charged against Group profits. Diversified Products John Beaton, 48, was Vice-President of Diversified Products, a group that consisted of the Latex, Plastics, and Specialty Products Divisions. This group was composed of high technology product categories that were expected to double sales within five years. In 1985, the group provided 27% of Polysar's sales revenue. Bentley, Ambridge, and Beaton reported to Robert Dudley, 60, President and Chief Executive Officer. Rubber Group A key component of Polysar's strategy was to be a leader in high margin, specialty rubbers. The leading products in this category were the butyl and halobutyl rubbers. Attributes of butyl rubber include low permeability to gas and moisture, resistance to steam and weathering, high energy absorption, and chemical resistance. Butyl rubber was traditionally used in inner tubes and general purpose applications. Halobutyl rubber, a modified derivative, possesses the same attributes as regular butyl with additional properties that allow bonding to other materials. Thus, halobutyls were used extensively as liners and sidewalls in tubeless tires. Butyl and halobutyl rubber were manufactured from feedstocks such as crude oil, naphtha, butane, propane, and ethane (Exhibit 4). Polysar manufactured butyl rubbers at two locations: NASA Division's Sarnia plant and EROW Division's Antwerp plant. NASA Butyl Plant The original Sarnia plant, built in 1942, manufactured regular butyl until 1972. At that time, market studies predicted rapid growth in the demand for high-quality radial tires manufactured with halobutyl. Demand for regular butyl was predicted to remain steady since poor road conditions in many countries of the world necessitated the use of tires with inner tubes. In 1972, the Sarnia plant was converted to allow production of halobutyls as well as regular butyl. By the 1980s, demand for halobutyl had increased to the point that Polysar forecast capacity constraints. During 1983 and 1984, the company built a second plant at Sarnia, known as Sarnia 2, to produce regular butyl. The original plant, Sarnia 1, was then dedicated solely to the production of halobutyl. Sarnia 2, with a capital cost of $550 million, began full operations late in 1984. Its annual nameplate (i.e., design) production capacity for regular butyl was 95,000 tonnes. During 1985, the plant produced 65,000 tonnes. EROW Butyl Plant The EROW Division's butyl plant was located in Antwerp, Belgium. Built in 1964 as a regular butyl unit, the plant was modified in 1979/80 to allow it to produce halobutyl as well as regular butyl. The annual nameplate production capacity of the Antwerp plant was 90,000 tonnes. In 1985, as in previous years, the plant operated near or at its nameplate capacity. The Antwerp plant was operated to meet fully the halobutyl demand of EROW customers, the remainder of capacity was used to produce regular butyl. In 1981, the plant's output was 75% regular butyl and 25% halobutyl; by 1985, halobutyl represented 50% of the plant's production. Since regular butyl demand outpaced the plant's remaining capacity, EROW took its regular butyl shortfall from the Sarnia 2 plant; in 1985, 21,000 tonnes of regular butyl were shipped from NASA to EROW. Product Scheduling Although NASA served customers in North and South America and EROW serviced customers in Europe and the rest of the world, regular butyl could be shipped from either the Sarnia 2 or Antwerp plant. NASA shipped approximately one-third of its regular butyl output to EROW. Also, customers located in distant locations could receive shipments from either plant due to certain cost or logistical advantages. For example, Antwerp sometimes shipped to Brazil and Sarnia sometimes shipped to the Far East. A Global Marketing Department worked with Regional Directors of Marketing and Regional Product Managers to coordinate product flows. Three sets of factors influenced these analyses. First, certain customers demanded products from a specific plant due to slight product differences resulting from the type of feedstock used and the plant configuration. Second, costs varied between Sarnia and Antwerp due to differences in variable costs (primarily feedstock and energy), shipping, and currency rates. Finally, inventory levels, production interruptions, and planned shutdowns were considered. In September and October of each year, NASA and EROW divisions prepared production estimates for the upcoming year. These estimates were based on estimated sales volumes and plant loadings (i.e., capacity utilization). Since the Antwerp plant operated at capacity, the planning exercise was largely for the benefit of the managers of the Sarnia 2 plant who needed to know how much regular butyl Antwerp would need from the Sarnia 2 plant. Product Costing and Transfer Prices Butyl rubbers were costed using standard rates for variable and fixed costs. Variable costs included feedstocks, chemicals, and energy. Standard variable cost per tonne of butyl was calculated by multiplying a standard utilization factor (i.e. the standard quantity of inputs used) by a standard price established for each unit of input. Since feedstock prices varied with worldwide market conditions and represented the largest component of costs, it was impossible to establish standard input prices that remained valid for extended periods. Therefore, the company reset feedstock standard costs each month to a price that reflected market prices. Chemical and energy standard costs were established annually. A purchase price variance (were input prices above or below standard prices?) and an efficiency variance (did production require more or less inputs than standard?) were calculated for variable costs each accounting period. Fixed costs comprised three categories of cost. Direct costs included direct labor, maintenance, chemicals required to keep the plant bubbling, and fixed utilities. Allocated cash costs included plant management, purchasing department costs, engineering, planning, and accounting. Allocated non-cash costs represented primarily depreciation. Fixed costs were allocated to production based on a plant's "demonstrated capacity" using the following formula, Standard Fixed Cost Per Tonne Estimated Annual Total Fixed Costs Annual Demonstrated Plant Capacity To apply the formula, production estimates were established each fall for the upcoming year. Then, the amount of total fixed costs applicable to this level of production was estimated. The amount of total fixed cost to be allocated to each tonne of output was calculated by dividing total fixed cost by the plant's demonstrated capacity. Exhibit 5 reproduces a section of the Controller's Guide that defines demonstrated capacity. Each accounting period, two variances were calculated for fixed costs. The first was a spending variance calculated as the simple difference between actual total fixed costs and estimated total fixed costs. The second variance was a volume variance calculated using the formula: = Volume Variance Standard Fixed Cost Per Tonne ). X ( [ Actual Tonnes ] - [ Demonstrated Capacity ]). Product transfers between divisions for performance accounting purposes were made at standard full cost, representing, for each tonne, the sum of standard variable cost and standard fixed cost. Compensation Employees at Polysar had in the past been paid by fixed salary with little use of bonuses except at the executive level of the company. In 1984, a bonus system was instituted throughout the company to link pay with performance and strengthen the profit center orientation. Non-management employees The bonus system varied by employee group but was developed with the intention of paying salaries that were approximately five percent less than those paid by a reference group of 25 major Canadian manufacturing companies. To augment salaries, annual bonuses were awarded, in amounts up to 12% of salary, based on corporate and Divisional performance. Hourly workers could receive annual bonuses in similar proportions based on performance. All bonuses were based on achieving or exceeding budgeted profit targets. For salaried workers, for example, meeting the 1985 corporate profit objective would result in a 5% bonus; an additional $25 million in profits would provide an additional 4% bonus. Meeting and exceeding Division profit targets could provide an additional 3% bonus. Using periodic accounting information, Divisional Vice-Presidents met in quarterly communication meetings with salaried and wage employees to discuss divisional and corporate performance levels. Management For managers, the percent of remuneration received through annual bonuses was greater than 12% and increased with responsibility levels. The bonuses of top Division management in 1985 were calculated by a formula that awarded 50% of bonus potential to meeting and exceeding Divisional profit targets and 50% to meeting or exceeding corporate profit targets. Interviews with Rubber Group Vice Presidents Pierre Choquette Pierre Choquette, 43, was Vice-President of the NASA Rubber Division. A professional engineer, Choquette had begun his career with Polysar in plant management. Over the years, he had assumed responsibilities for product management in the U.S., managed a small subsidiary, managed a European plant, and directed European sales. This business is managed on price and margin. Quality, service, and technology are also important, but it is difficult to differentiate ourselves from other competitors on these dimensions. When the price of oil took off, this affected our feedstock prices drastically, and Polysar's worldwide business suffered. Now that prices are back down, we are trying to regroup our efforts and bring the business back to long term health. Polysar will break even in 1985 and show a normal profit again in 1986. Of course, the Rubber Division will, as in the past, be the major producer of profit for the company. As you know, this is a continuous process industry. The plant is computerized so that we need the same number of people and incur most of the same overhead costs whether the plant is running fast or slow. The regular butyl plant, Sarnia 2, is running at less than capacity. Although the plant should be able to produce 95,000 tonnes, its demonstrated capacity is 85,000. Last year, we produced 65,000. This leaves us sitting with a lot of unabsorbed fixed costs, especially when you consider depreciation charges. Still, NASA Rubber has been growing nicely. I think that this is in part due to our strong commitment to run the Divisions as profit centers. We have been pushing hard to build both volume and efficiency and I am pleased that our programs and incentives are paying off. Our transfers to EROW are still a problem. Since the transfers are at standard cost and are not recorded as revenue, these transfers do nothing for our profit. Also, if they cut back on orders, our profit is hurt through the volume variance. Few of our senior managers truly understand the volume variance and why profit results are so different in the two regions. The accounting is not a problem, but having to continuously explain it to very senior-level managers is. It always comes down to the huge asset that we carry whether the plant is at capacity or not. We run our businesses on return on net assets which looks ridiculous for NASA. I worry that if I am not around to explain it, people will form the wrong 2 Pierre Choquette was interviewed at Harvard Business School in 1985; Doug Henderson was interviewed at Harvard in 1986. Both men were attending the thirteen-week Advanced Management Program that was developed to strengthen the management skills of individuals with potential to become chief executive officers of their companies. In addition to Choquette and Henderson, Polysar had sent Firman Bentley to the program in 1984. 3Due to its relatively large size, Rubber Group was the only group with regional vice presidents. Regional responsibilities of the Basic Petrochemicals group and the Diversified Products group were managed by lower- ranking general managers. conclusion about the health of the business. Also, you sometimes wonder if people ascribe results to factors that are outside your control." Doug Henderson Doug Henderson, 46, Vice-President of EROW Rubber Division, was also a professional engineer. His career included management responsibilities in plant operations, market research, venture analysis and corporate planning, running a small regional business in Canada, and Director of European Sales. The Antwerp plant produces about 45,000 tonnes of halobutyl and 45,000 tonnes of regular butyl each year. In addition, we import approximately 15,000 to 20,000 tonnes of regular butyl from Sarnia each year Exhibit 6. We inform Sarnia each fall of our estimated regular butyl needs. These estimates are based on our predictions of butyl and halobutyl sales and how hard we can load our plant. The overall sales estimates are usually within ten percent, say plus or minus 8,000 tonnes, unless an unexpected crisis occurs. The EROW business has been extremely successful since I arrived here in 1982. We have increased our share in the high growth halobutyl market; the plant is running well; and we have kept the operation simple and compact. Looking at our Statement of Net Contribution Exhibit 7, our margins are better than NASA's. For one thing, there is a great surplus of feedstock in Europe and we benefit from lower prices. Also, market dynamics are substantially different. We pay a lot of attention to plant capacity. For example, we budgeted to produce 250 tonnes per day this year and we have got it up to 275. We are also working hard to reduce our off-spec" material as a way of pushing up our yield. If we can produce more, it's freeother than variable cost, it goes right to the bottom line. Given these factors, Pierre loves it when I tell him jokingly that our success at EROW is attributable to superb management. Exhibit 1 NASA RUBBER DIVISIONRegular Butyl RubberStatistics and Analyses, September 1986 Nine Months Ended September 30, 1986 Actual Budget Deviation (*000s) ("000s) (*000s) Volume-Tonnes 35.8 47.5 33.0 55.0 2.8 -7.5 Sales Production Transfers to EROW from EROW 12.2 2.1 19.5 1.0 -7.3 1.1 Production Costs ($'000s) ($'000s) ($'000s) Fixed Cost-Direct -Allocated Cash -Allocated Non-Cash - 21,466 7,036 - 15,625 - 21,900 - 7,125 - 15,600 434 89 25 Fixed Cost to Production - 44,127 - 44,625 498 Transfers to/from FG Inventory Transfers to EROW Transfers from EROW 1,120 8,540 - 1,302 2,450 13,650 620 - 1,330 -5,110 682 Fixed Cost of Sales - 35,769 -29,145 - 6,624 Note: As indicated on p. 1 of the case, financial data have been disguised and do not represent the true financial results of the company. Exhibit 2 NASA RUBBER DIVISIONRegular Butyl Rubber-Statement of Net Contribution, September 1986 Nine Months Ended September 30, 1986 Actual Budget Deviation ($ '000s) ($ '000s) ($ '000s) 65,872 61,050 210 160 Sales Revenue-Third Party -Diversified Products Group -Total Delivery Cost Net Sales Revenue 4,822 50 4,722 66,032 - 2,793 63,239 61,260 - 2,600 58,660 193 4,579 -21,450 Variable Costs Standard Cost Adjustments Efficiency Variance Total -22,589 54 241 -22,294 -1,139 54 241 -21,450 844 Gross Margin-$ 40,945 37,210 3,735 - 1,960 -25,060 168 -23,100 80 88 498 Fixed Costs Standard Cost Adjustments Spending Variance Volume Variance Total Gross Profit-$ -% of NSR 498 -5,250 -11,375 -35,769 6,125 -29, 145 8,065 13.7% 5,176 8.2% -6,624 -2,889 -5.5% 163 Period Costs Administration, Selling, Distribution Technical Service Other Income/Expense Total - 4,163 - 222 208 - 4,177 - 4,000 - 210 50 - 4,160 12 158 17 999 Business Contribution Interest on Working Capital 3,905 - 1,900 - 2,906 25 - 1,875 Net Contribution 876 2,005 -2,881 Note: As indicated on p. 1 of the case, financial data have been disguised and do not represent the true financial results of the company. Exhibit 6 Schedule of Regular Butyl Shipments from NASA to EROW Actual Tonnes Budget Tonnes 1985 1984 1983 1982 1981 21,710 12,831 1,432 792 1,069 23,500 13,700 4,000 600 700 Exhibit 7 EROW RUBBER DIVISIONRegular Butyl Rubber-Condensed Statement of Net Contribution, September 1986 Nine Months Ended September 30, 1986 Sales VolumeTonnes 47,850 ($'000s) Sales Revenue Delivery Cost Net Sales Revenue 94,504 - 4,584 89,920 Variable Cost Standard Purchase Price Variance Inventory Revaluation Efficiency Variance Total Gross Margin-$ -28,662 203 46 32 -28,473 61,447 Fixed Cost to Production Depreciation Other Transfers to/from F. G. Inventory Transfers to/from NASA - 4,900 -16,390 -21,290 - 775 - 7.238 - 9,303 32,144 - 7,560 24,584 - 1,923 Gross Profit-$ Period Costs Business Contribution Interest on W/C /C Net Contribution 22.661 Notes: 1. Fixed costs are allocated between regular butyl production (above) and halobutyl production (reported separately). As indicated on p. 1 of the case, financial data have been disguised and do not represent the true financial results of the company. 2