

Answered step by step
Verified Expert Solution
Question
1 Approved Answer
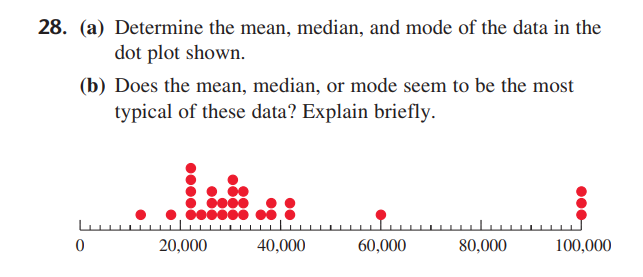
Explanation and step-by-step solution 28. (a) Determine the mean, median, and mode of the data in the dot plot shown. (b) Does the mean, median,
Explanation and step-by-step solution
Step by Step Solution
There are 3 Steps involved in it
Step: 1

Get Instant Access to Expert-Tailored Solutions
See step-by-step solutions with expert insights and AI powered tools for academic success
Step: 2

Step: 3
Ace Your Homework with AI
Get the answers you need in no time with our AI-driven, step-by-step assistance
Get Started
Algebra And Trigonometry
Authors: Cynthia Y Young
3rd Edition
1118475755, 9781118475751