

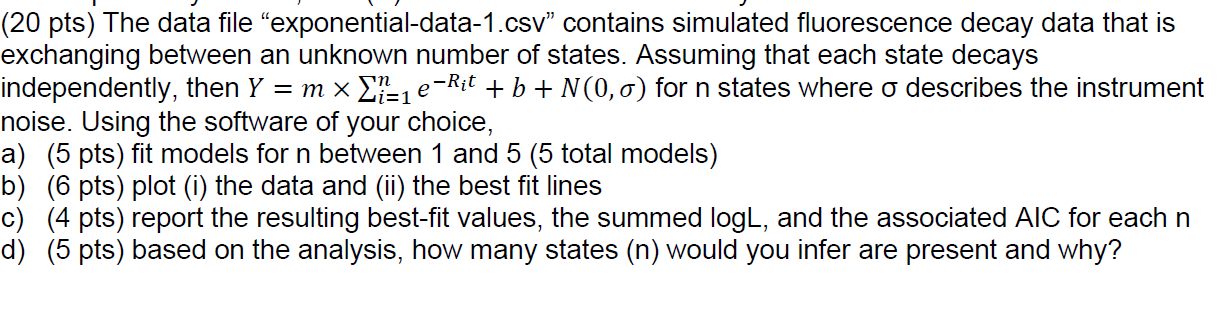
Question
Exponential Data 1 Time Fluorescence 0.21666666666666667 2.2229405970230673 0.23333333333333334 2.1380382172476224 0.25 2.2444369345148543 0.26666666666666666 2.1975859661635115 0.2833333333333333 2.159979996117131 0.3 2.1805185491317993 0.31666666666666665 2.187114154256918 0.3333333333333333 2.2124154654500727 0.35 2.060334926963474 0.36666666666666664 1.864714111419577
Exponential Data 1
| Time | Fluorescence |
| 0.21666666666666667 | 2.2229405970230673 |
| 0.23333333333333334 | 2.1380382172476224 |
| 0.25 | 2.2444369345148543 |
| 0.26666666666666666 | 2.1975859661635115 |
| 0.2833333333333333 | 2.159979996117131 |
| 0.3 | 2.1805185491317993 |
| 0.31666666666666665 | 2.187114154256918 |
| 0.3333333333333333 | 2.2124154654500727 |
| 0.35 | 2.060334926963474 |
| 0.36666666666666664 | 1.864714111419577 |
| 0.3833333333333333 | 1.8842371381318022 |
| 0.4 | 2.0179258992800384 |
| 0.4166666666666667 | 1.954189779053079 |
| 0.43333333333333335 | 2.0039005143333837 |
| 0.45 | 1.8009050926832557 |
|
|
Step by Step Solution
There are 3 Steps involved in it
Step: 1

Get Instant Access to Expert-Tailored Solutions
See step-by-step solutions with expert insights and AI powered tools for academic success
Step: 2

Step: 3
Ace Your Homework with AI
Get the answers you need in no time with our AI-driven, step-by-step assistance
Get Started
Advances In Databases And Information Systems 23rd European Conference Adbis 2019 Bled Slovenia September 8 11 2019 Proceedings Lncs 11695
Authors: Tatjana Welzer ,Johann Eder ,Vili Podgorelec ,Aida Kamisalic Latific
1st Edition
3030287297, 978-3030287290