

Question
Extra Credit How does this problem differ from the one we solved in HW6? (Besides from the fact that we are using two demand curves
Extra Credit
How does this problem differ from the one we solved in HW6? (Besides from the fact that we are using two demand curves in the present problem, while we used three in HW6. This is NOT the answer.)
In particular, how does the ATC function in this problem make the solution more "simultaneous" than the ATC function in HW6.
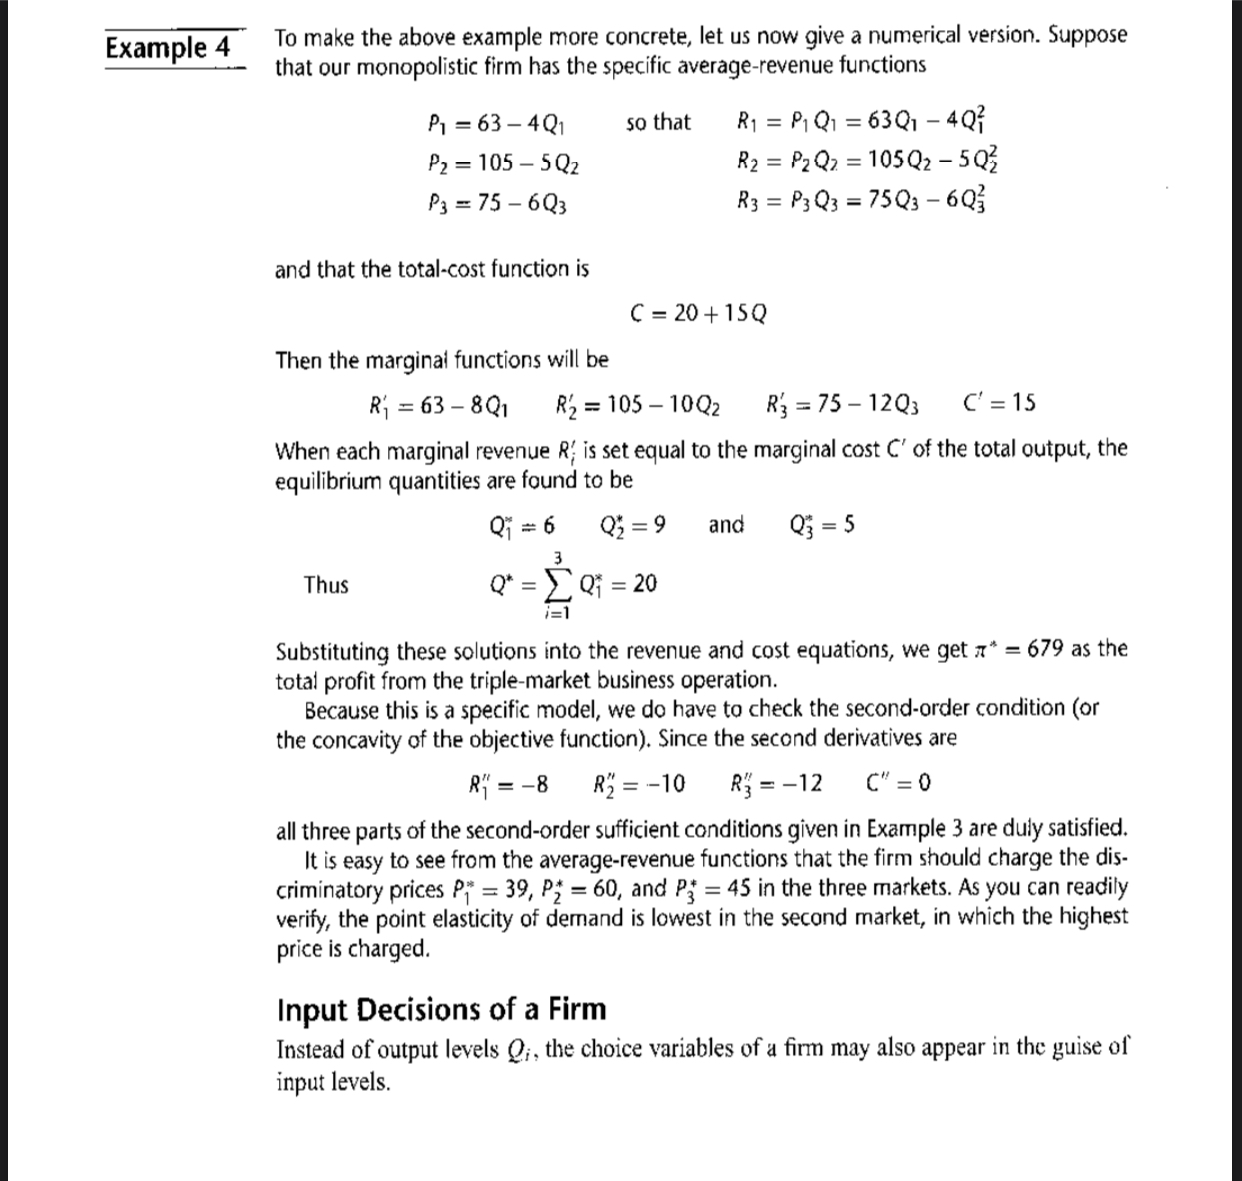
In case you forgot, in HW6, the ATC function was ATC = 20/Q + 15, and the demand curves were 63 -4Q1 105 - 5Q2 and P3 = 75 - 6Q3THE PROBLEM:
1) A monopolist sells a product in two separate markets at different prices; i.e., he price discriminates. The demand curves in these markets are:
100 - QA and PB = 60 - 0.5QB
His average cost function (ATC) is: ATC = Q + 100/Q where Q = QA + QB
In your calculations, let be defined as profit.
(Hint: Find an equation form. Then replace Q with QA+ QB. Then, maximize with respect to QA and QB.)
a)Use Cramer's Rule to find the profit maximizing quantities QA* and QB*.
(If you absolutely do not remember Cramer's rule, do it any way you can.)
You do NOT have to check second derivative conditions for a maximum.
b)Find the maximum profit,
c)Find where QA*+ QB*
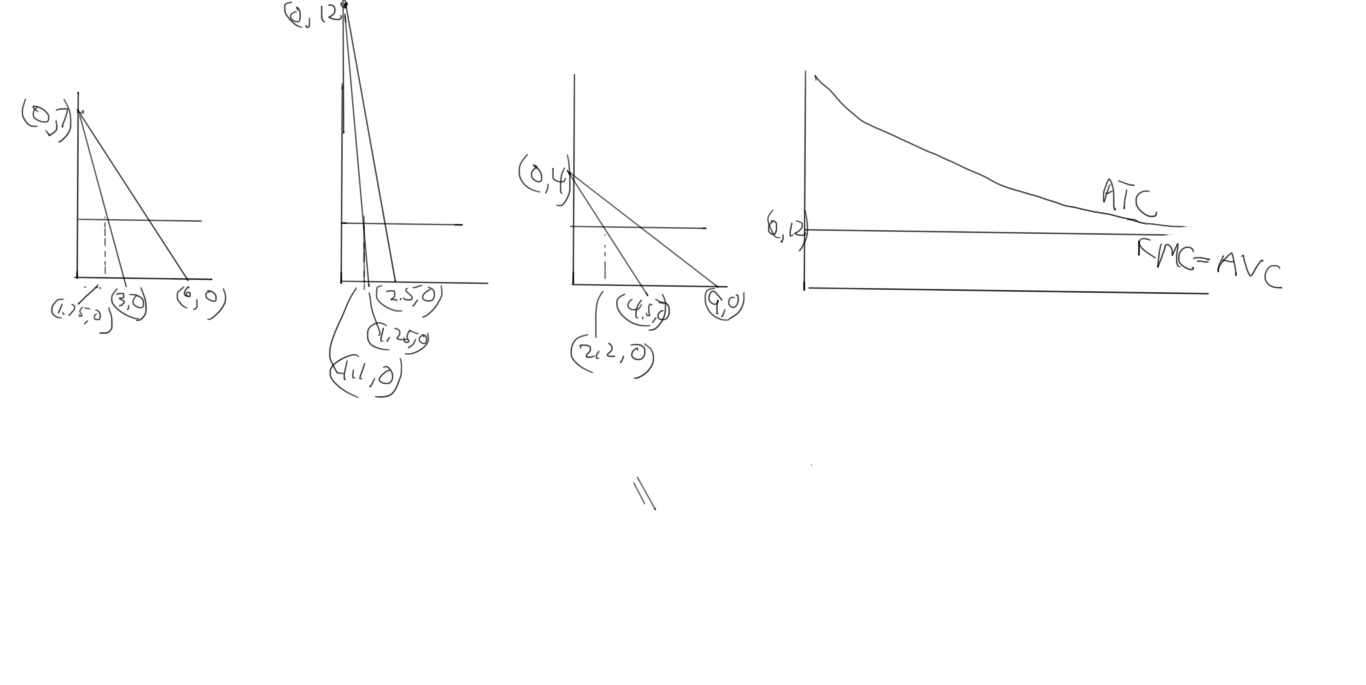
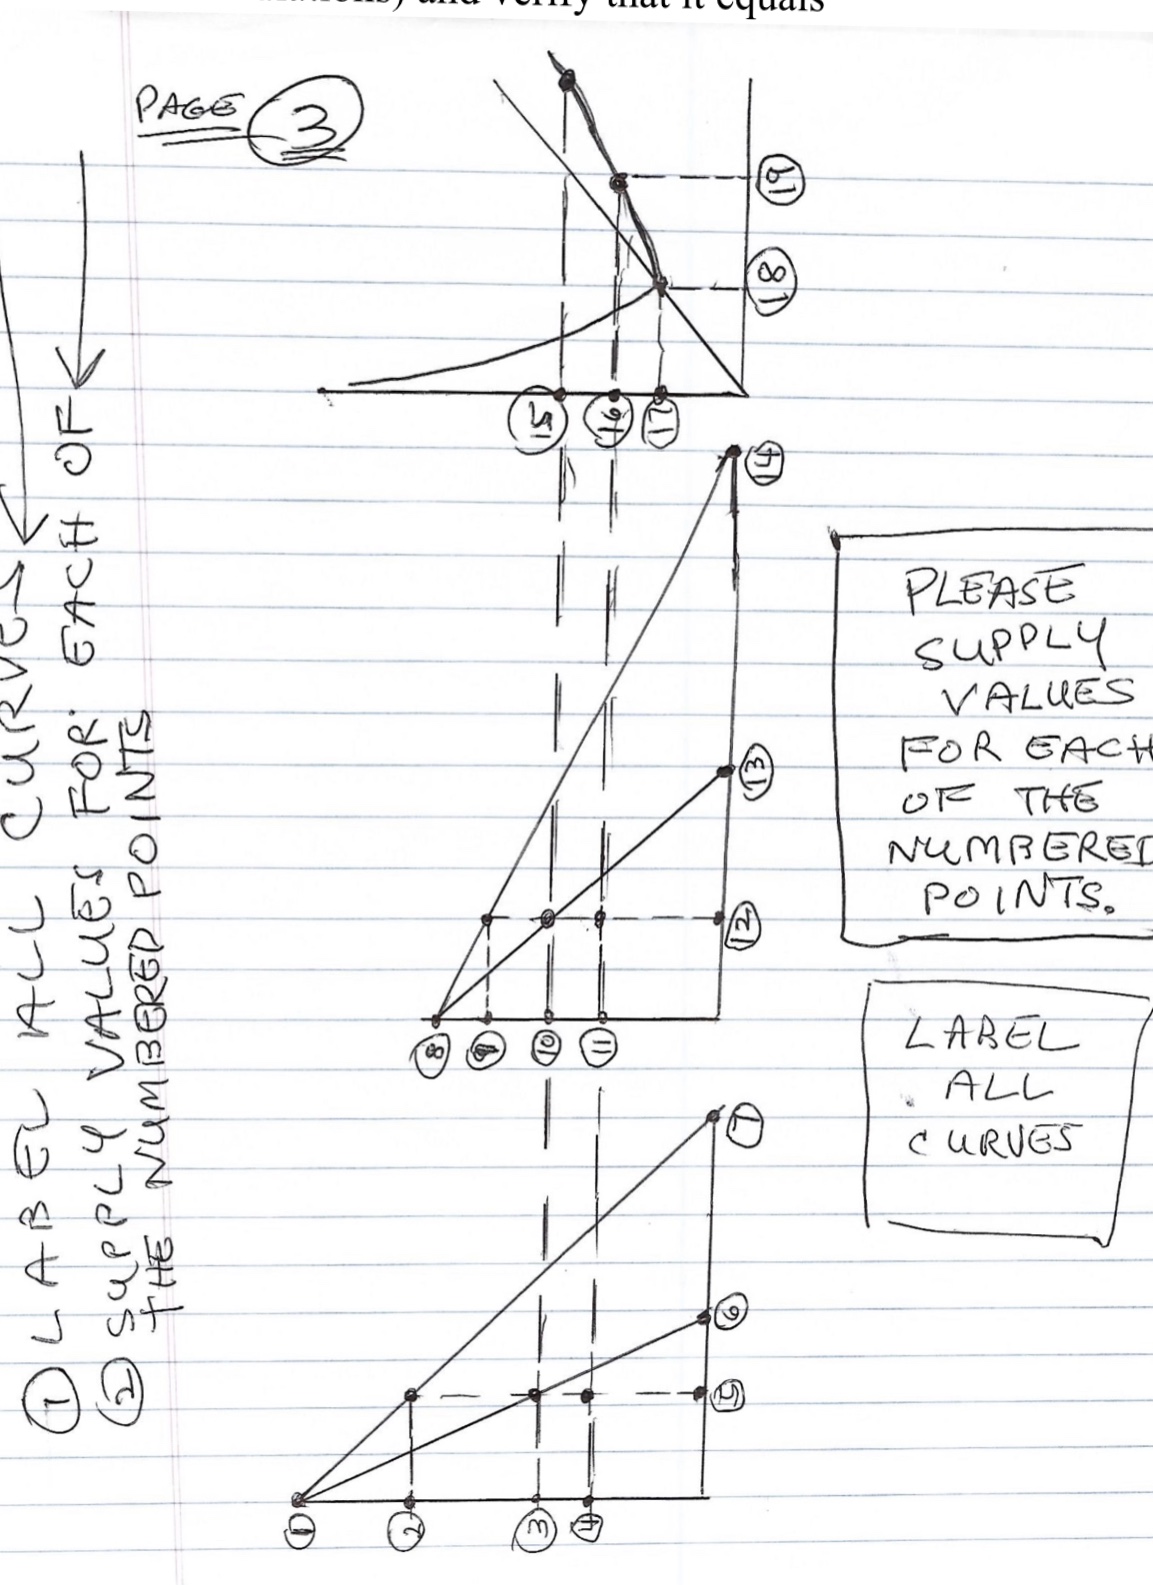
d)Graph the solution, as we did in HW6. You should have two graphs of demand curves and one graph of cost curves. The following page has a sample set of graphs that you can use as a guide, with all labels and coordinates missing.
Label the curves and lines in each graph. On the sample, I have labeled 19 points with plain numbers. Replace these numbers with the values from your solution. NOTICE that the graphs line up horizontally. For example, numbers 4, 11, and 16 should have the same value. Similarly, 3, 10, and 15 should have the same value. Show the profit in each market on the graphs. (It is a rectangle.)
Calculate the profit in each market (show your calculations) and verify that it equals
Step by Step Solution
There are 3 Steps involved in it
Step: 1

Get Instant Access to Expert-Tailored Solutions
See step-by-step solutions with expert insights and AI powered tools for academic success
Step: 2

Step: 3
Ace Your Homework with AI
Get the answers you need in no time with our AI-driven, step-by-step assistance
Get Started
Intermediate Microeconomics and Its Application
Authors: walter nicholson, christopher snyder
11th edition
9781111784300, 324599102, 1111784302, 978-0324599107