

Answered step by step
Verified Expert Solution
Question
1 Approved Answer
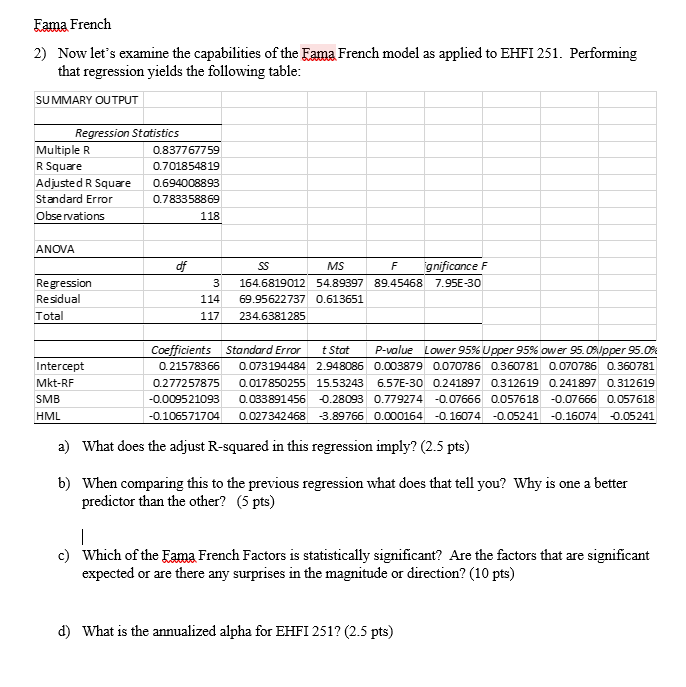
Fama French 2) Now let's examine the capabilities of the Fama French model as applied to EHFI 251. Performing that regression yields the following table:
Step by Step Solution
There are 3 Steps involved in it
Step: 1

Get Instant Access to Expert-Tailored Solutions
See step-by-step solutions with expert insights and AI powered tools for academic success
Step: 2

Step: 3
Ace Your Homework with AI
Get the answers you need in no time with our AI-driven, step-by-step assistance
Get Started
A Study In Public Finance
Authors: A. C. Pigou
1st Edition
1443722766, 978-1443722766