

Question
Ferrari - The 2015 Initial Public Offering 1. Use the market multiple approach to calculate share price. What are the strengths and weaknesses of this
Ferrari - The 2015 Initial Public Offering
1. Use the market multiple approach to calculate share price. What are the strengths and weaknesses of this approach in valuation? Please use at least (EV/EBITDA). Show calculations. Explain in detail.
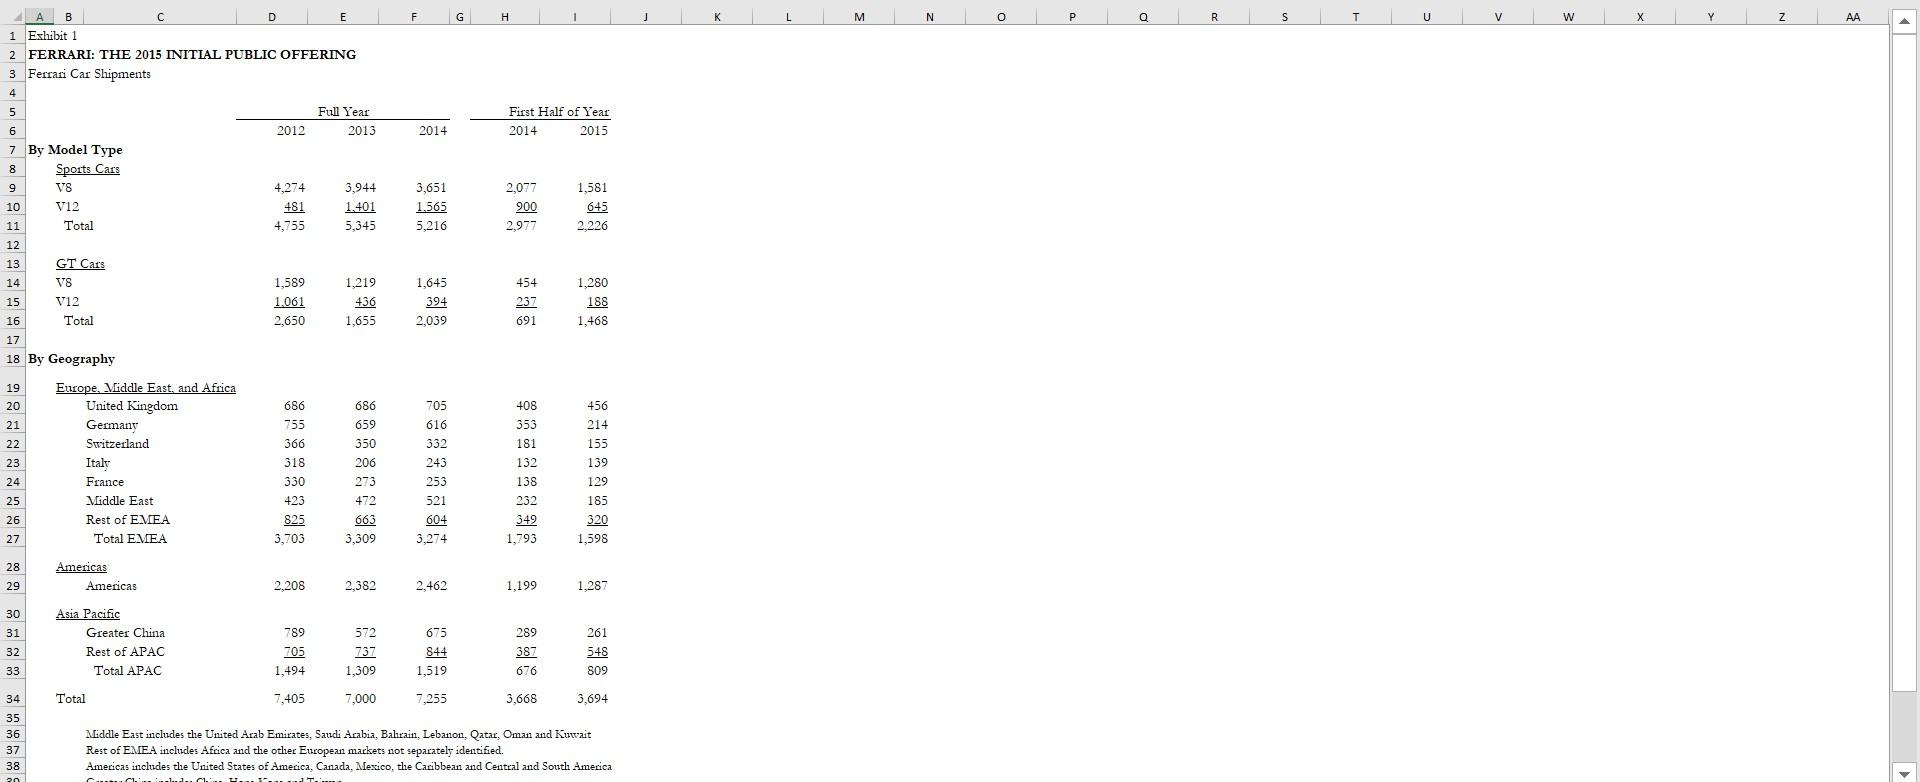
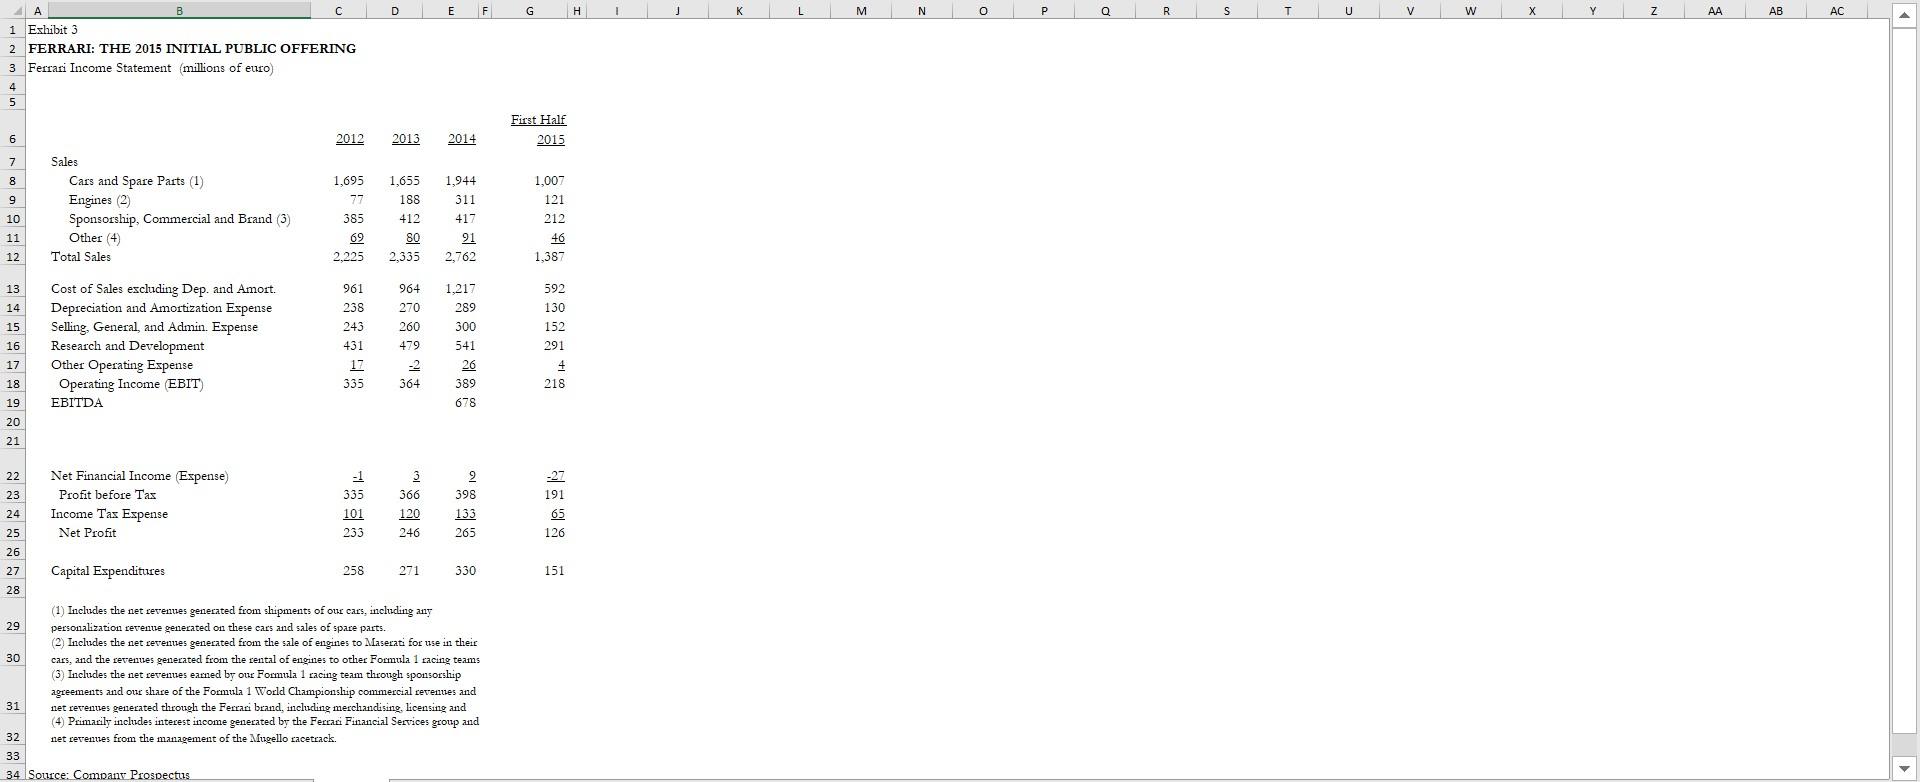
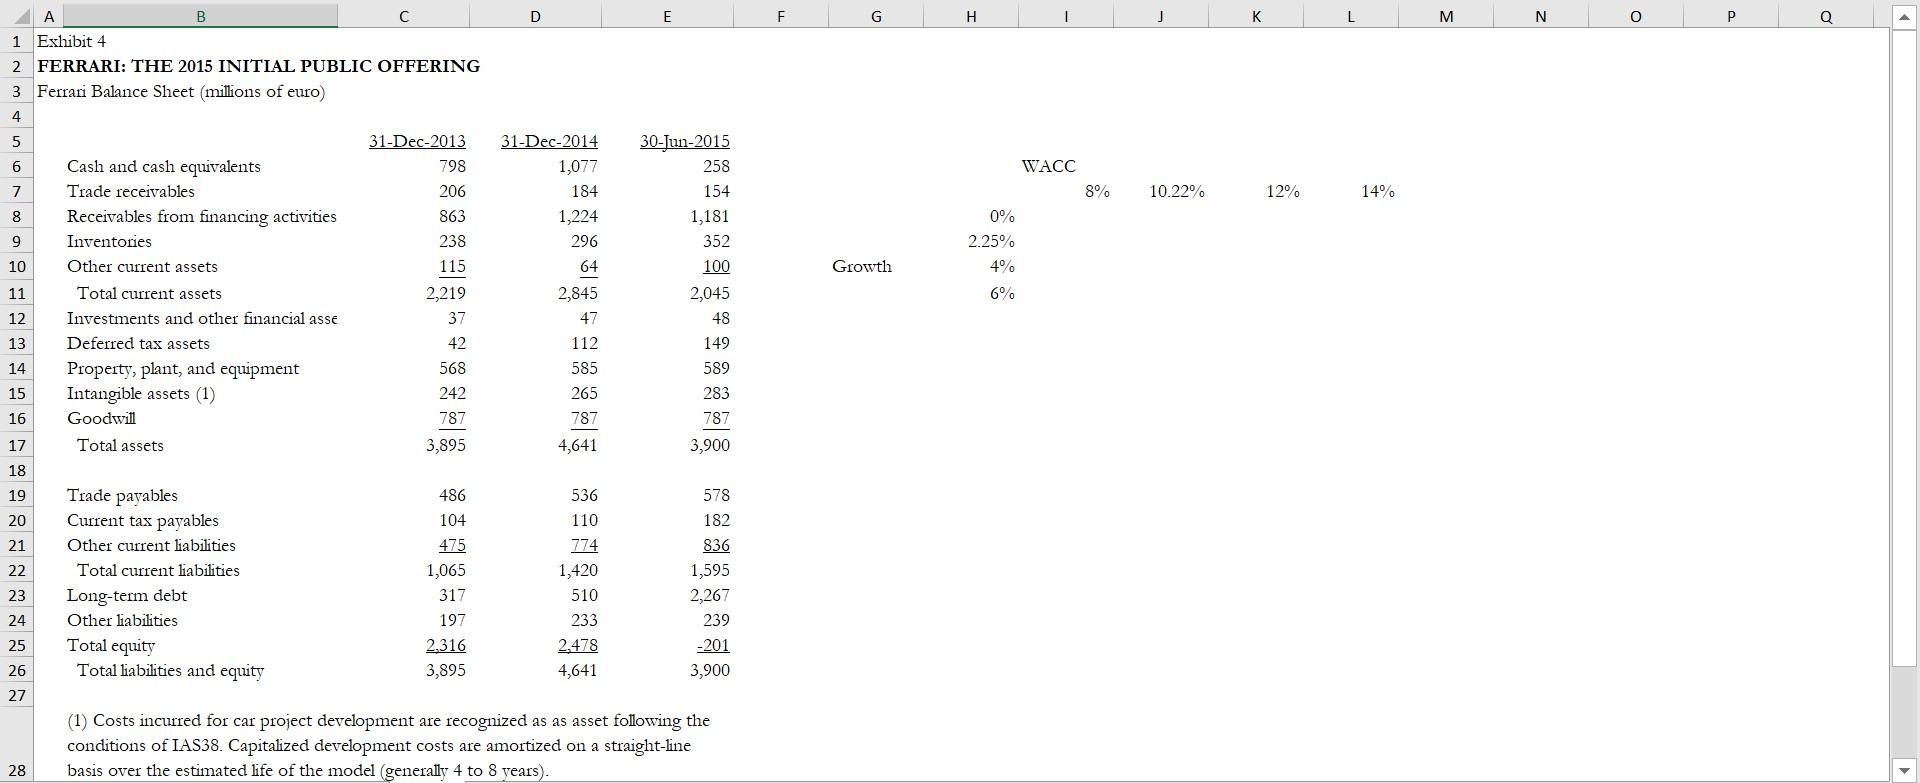
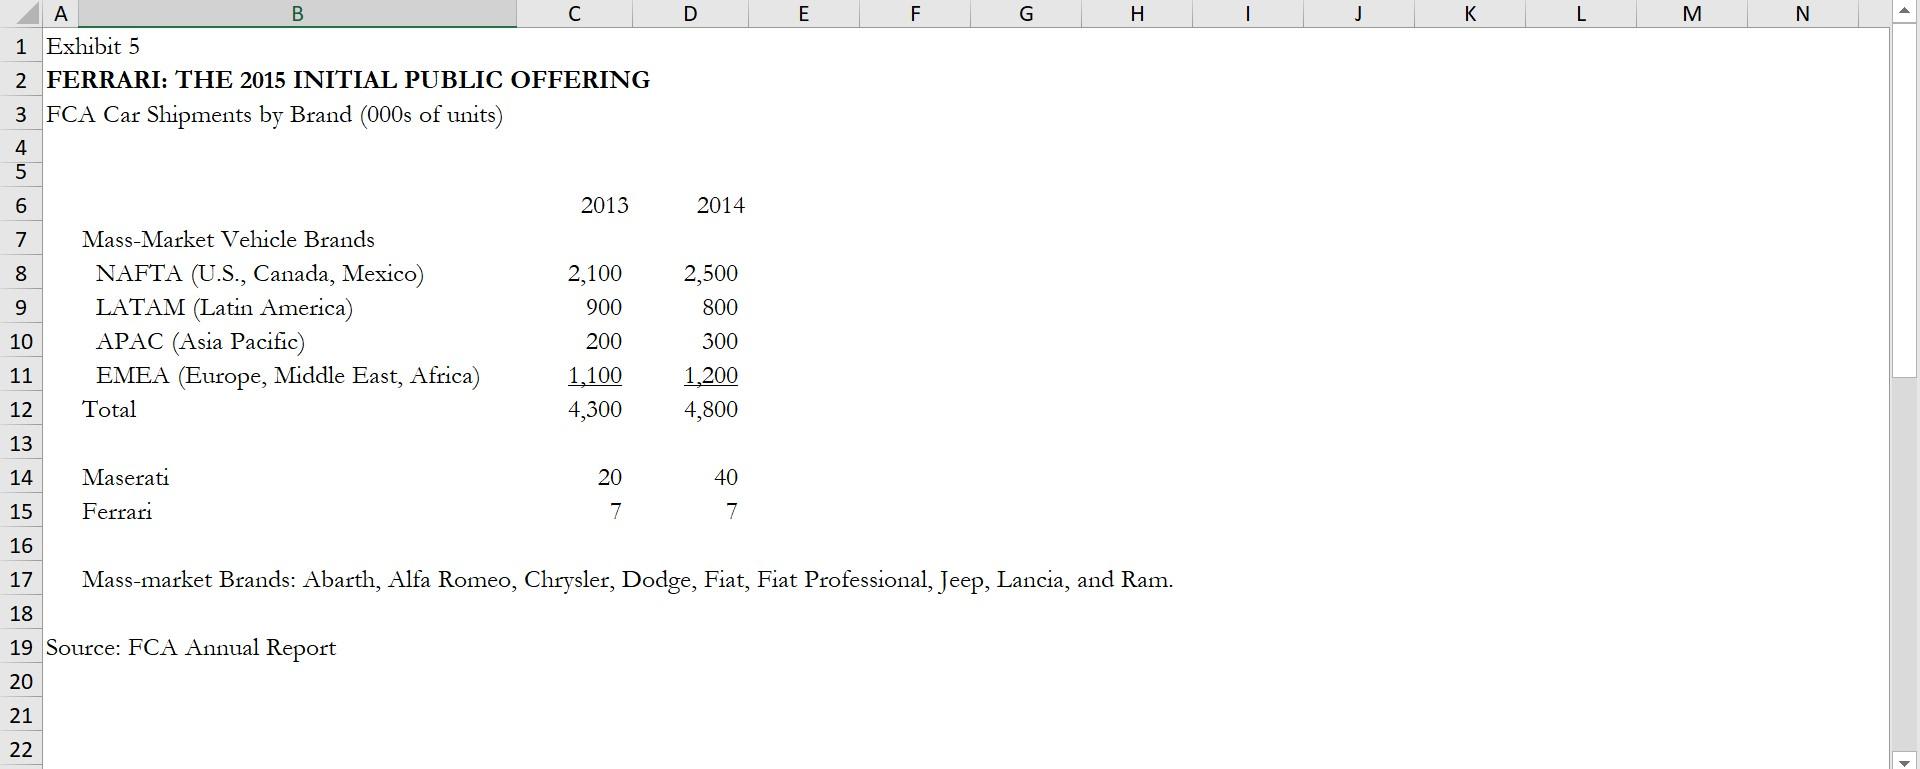
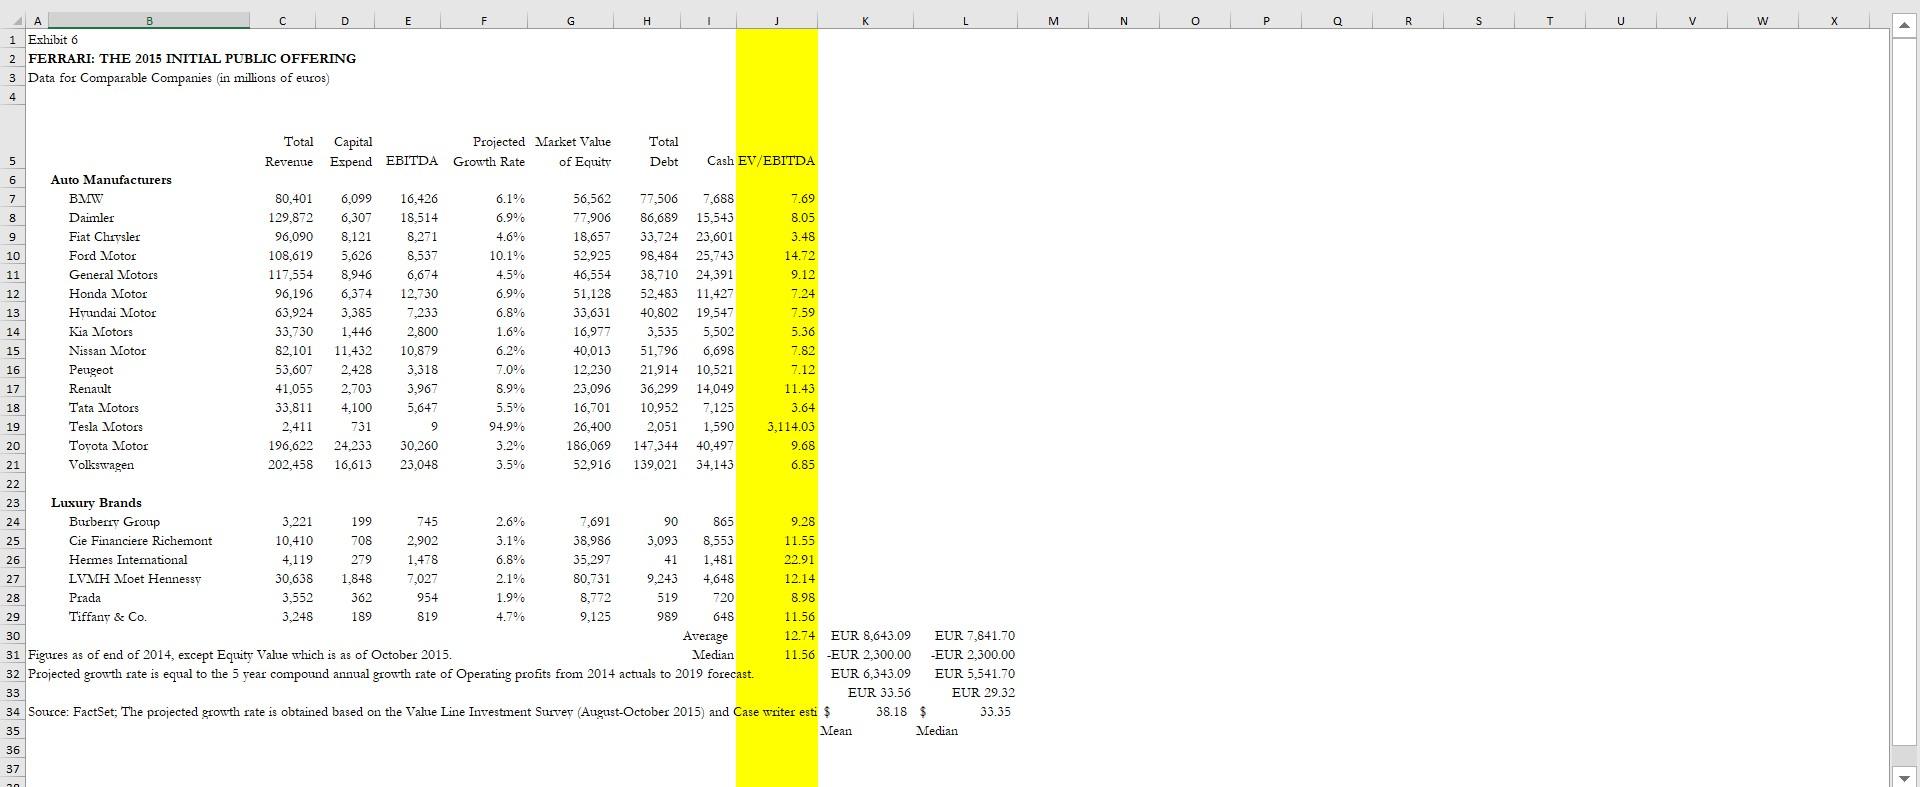
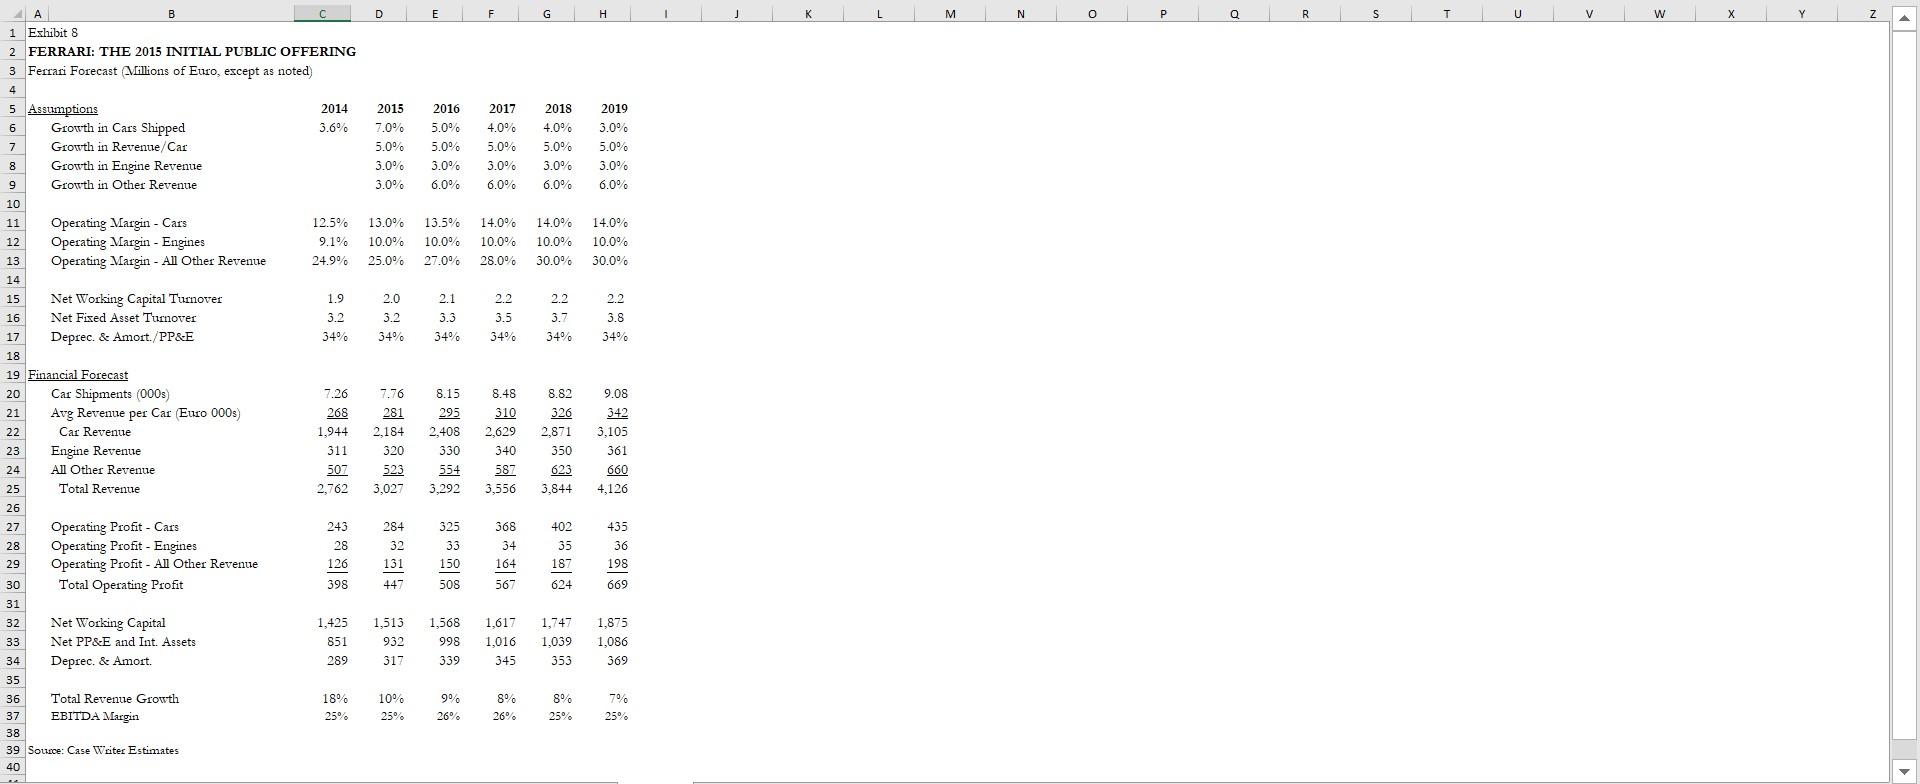
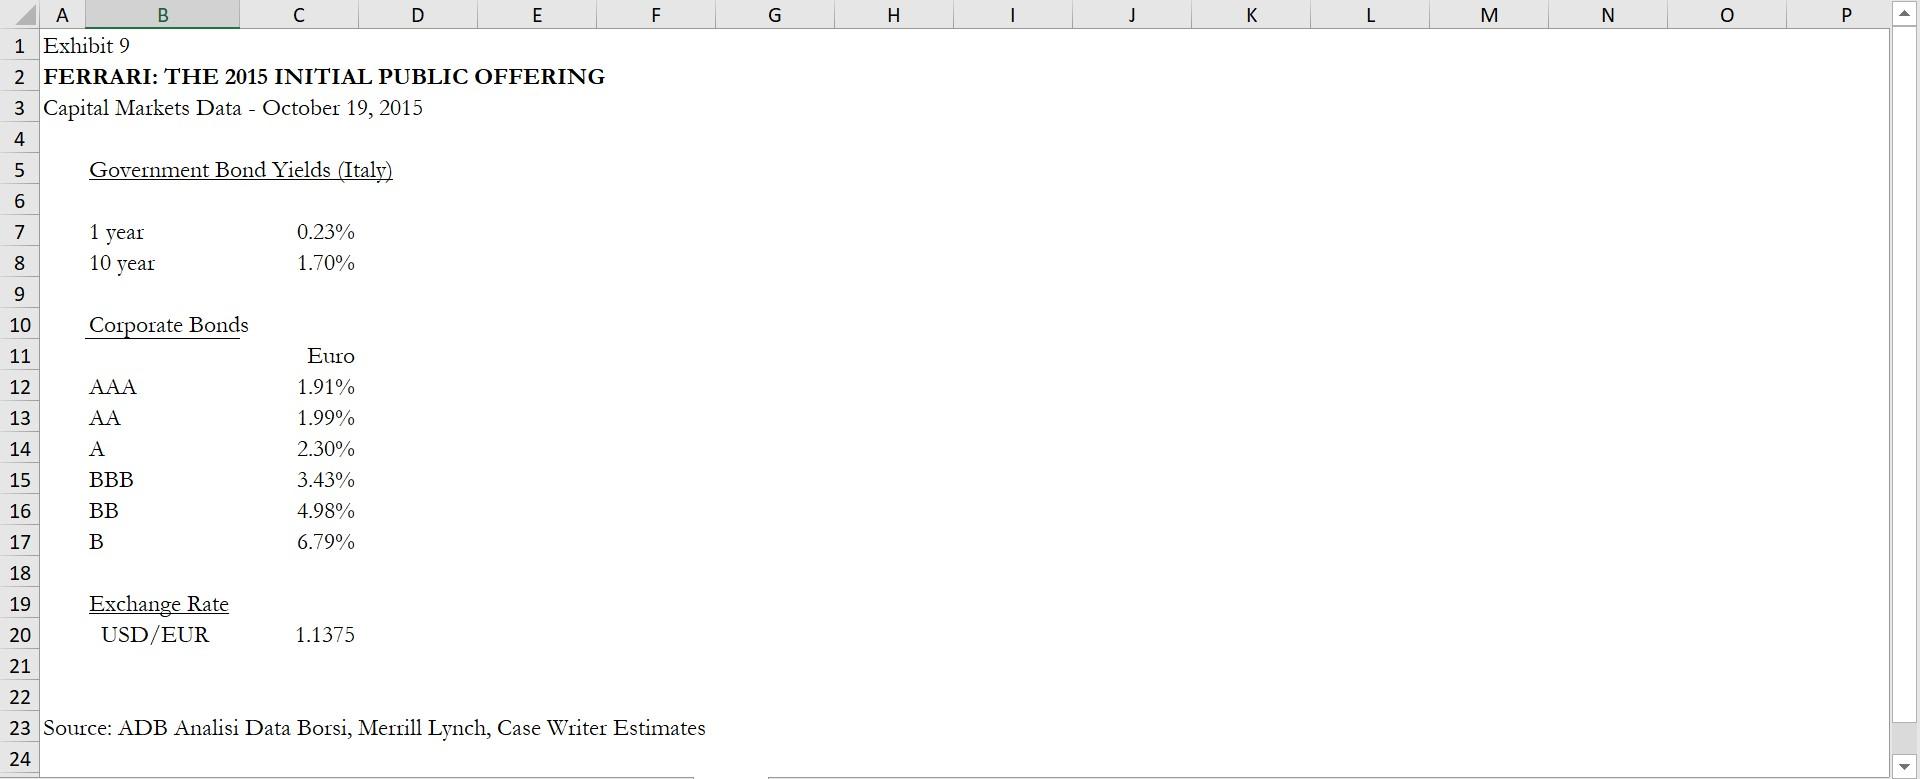
F G H M N O R S U V w X AA B E 1 Exhibit 1 2 FERRARI: THE 2015 INITIAL PUBLIC OFFERING 3 Ferrari Car Shipments 4 5 Full Year 6 2012 2013 7 By Model Type 8 Sports Cars 9 V8 4,274 3,944 10 V12 481 1.401 11 4,755 First Half of Year 2014 2015 2014 3,651 1.565 2,077 900 1,581 645 2.226 Total 5,345 5,216 2,977 12 1,589 1.061 1,219 436 1,655 1,645 394 2,039 454 237 691 1,280 188 1,468 2,650 13 GT Cars 14 Vs 15 V12 16 Total 17 18 By Geography 19 Europe, Middle East, and Africa 20 United Kingdom 21 Germany 22 Switzerland Italy 24 France 25 Middle East 26 Rest of EMEA 27 Total EMEA 686 755 366 318 330 423 825 3,703 686 659 350 206 273 472 663 3,309 705 616 332 243 253 521 604 3,274 408 353 181 132 138 232 342 1,793 456 214 155 139 129 185 320 1,598 28 Americas Americas 29 2.208 2382 2,462 1,199 1,287 30 31 32 33 Asia Pacific Greater China Rest of APAC Total APAC 789 705 1,494 572 737 1,309 675 844 1,519 289 387 676 261 548 809 34 Total 7,405 7,000 7,255 3,668 3,694 35 36 37 38 20 Middle East includes the United Arab Emirates, Saudi Arabia, Bahrain, Lebanon, Qatar, Oman and Kuwait Rest of EMEA includes Africa and the other European markets 110t separately identified. Americas includes the United States of America, Canada, Mexico, the Caribbean and Central and South America - E F G N P Q R T U V W Z AA AB AC 4A 1 Exhibit 3 2 FERRARI: THE 2015 INITIAL PUBLIC OFFERING 3 Ferrari Income Statement millions of euro) 4 5 First Half 2015 6 2012 2013 2014 7 8 Sales Cars and Spare Parts (1) Engines (2) Sponsorship, Commercial and Brand (3) 1,695 77 385 69 2005 9 10 11 12 1,655 188 412 80 2.335 1,944 311 417 91 2,762 1,007 121 212 Other 4 Total Sales 1,387 13 14 Cost of Sales excluding Dep. and Amort. Depreciation and Amortization Expense Selling, General, and Admin. Espense Research and Development Other Operating Espense Operating Income (EBIT) EBITDA 961 238 243 431 17 335 15 964 270 260 479 -2 364 33******* 1,217 289 300 541 26 389 678 592 130 152 291 16 # 17 18 19 218 20 21 22 23 24 25 26 27 Net Financial Income Expense) Profit before Tax Income Tax Espense Net Profit -1 335 101 233 3 366 120 246 2 398 133 265 191 65 126 Capital Espenditures 258 271 330 151 28 29 30 (1) Includes the net revenues generated from shipments of ous cars, including any personalization revenue generated on these cars and sales of space parts. (2) Includes the net revenues genecated from the sale of engines to Maserati for use in their cars, and the Levenues genecated from the rental of engines to other Fomula 1 cacing teams (3) Includes the net revenues eamed by our Fomula 1 racing team through sponsorship agreements and our share of the Formula 1 World Championship commercial cevenues and net revenues generated through the Ferraci brand, including merchandising licensing and (4) Primarily includes interest income generated by the Ferrari Financial Services group and net revenues from the management of the Mugello cacetrack. 33 34 Source: Company Prospectus 31 32 G H K L M N 10.22% 12% 14% WACC 8% 0% 2.25% 49% 6% 238 Growth 585 C 1 Exhibit 4 2 FERRARI: THE 2015 INITIAL PUBLIC OFFERING 3 Ferrari Balance Sheet (millions of euro) 4 5 31-Dec-2013 31-Dec-2014 30-Jun-2015 6 Cash and cash equivalents 798 1,077 258 7 Trade receivables 206 184 154 8 Receivables from financing activities 863 1,224 1,181 9 Inventories 296 352 10 Other current assets 115 64 100 11 Total current assets 2,219 2,845 2,045 12 Investments and other financial asse 37 47 48 13 Deferred tax assets 42 112 149 14 Property, plant, and equipment 568 589 15 Intangible assets (1) 265 283 16 Goodwill 787 787 787 17 Total assets 3,895 4,641 3,900 18 19 Trade payables 486 536 578 20 Current tax payables 104 110 182 21 Other current liabilities 475 774 836 22 Total current liabilities 1,065 1,420 1,595 23 Long-term debt 317 510 2,267 24 Other liabilities 197 239 25 Total equity 2.316 2,478 -201 26 Total liabilities and equity 3,895 4,641 3,900 27 (1) Costs incurred for car project development are recognized as as asset following the conditions of IAS38. Capitalized development costs are amortized on a straight-line 28 basis over the estimated life of the model (generally 4 to 8 years). 242 233 A B D E F G H J K L M N Nm 0 m 2014 1 Exhibit 5 2 FERRARI: THE 2015 INITIAL PUBLIC OFFERING 3 FCA Car Shipments by Brand (000s of units) 4 5 6 2013 7 Mass-Market Vehicle Brands 8 NAFTA (U.S., Canada, Mexico) 2,100 9 LATAM (Latin America) 900 10 APAC (Asia Pacific) 200 11 EMEA (Europe, Middle East, Africa) 1,100 12 Total 4,300 2,500 800 300 1,200 4,800 13 14 Maserati 20 40 15 Ferrari 7 7 16 17 Mass-market Brands: Abarth, Alfa Romeo, Chrysler, Dodge, Fiat, Fiat Professional, Jeep, Lancia, and Ram. 18 19 Source: FCA Annual Report 20 21 22 G H J M N 0 Q R S T U w X D 1 Exhibit 6 2 FERRARI: THE 2015 INITIAL PUBLIC OFFERING 3 Data for Comparable Companies in millions of euros) 4 5.647 Total Capital Projected Market Value Total 5 Revenue Espend EBITDA Growth Rate of Equity Debt Cash EV/EBITDA 6 Auto Manufacturers 7 BMW 80,401 6,099 16,426 6.1% 56,562 77,506 7,688 7.69 8 Daimler 129,872 6,307 18,514 6.9% 77,906 86,689 15,543 8.05 9 Fiat Chrvsler 96.090 8,121 8,271 4.6% 18,657 33,724 23,601 3.48 10 Ford Motor 108,619 5,626 8.537 10.1% 52,925 98,484 25,743 14,72 11 General Motors 117,554 8,946 6,674 4.5% 46,554 38,710 24,391 9.12 12 Honda Motor 96,196 6,374 12,730 6.9% 51,128 52,483 11,427 7.24 13 Hyundai Motor 63,924 3,385 7,233 6.8% 33,631 40.802 19,547 7.59 14 Kia Motors 33,730 1,446 2.800 1.6% 16,977 3,535 5,502 5.36 15 Nissan Motor 82,101 11,432 10,879 6.2 40,013 51,796 6,698 7.82 16 Peugeot 53,607 2,428 3,318 7.0% 12.230 21,914 10.521 7.12 17 Renault 41,055 2,703 3,967 8.9% 23,096 36,299 14,049 11.43 18 Tata Motors 33,811 4,100 5.5% 16,701 10,952 7,125 3.64 19 Tesla Motors 2,411 731 9 94.9% 26,400 2,051 1,590 3,114.03 20 Tovota Motor 196,622 24.233 30,260 3.2% 186,069 147,344 40,497 9.68 21 Volkswagen 202,458 16,613 23,048 3.5% 52,916 139,021 34,143 6.85 22 23 Luxury Brands 24 Burberry Group 3.221 199 745 2.6% 7,691 90 865 9.28 25 Cie Financiere Richemont 10,410 708 2,902 38,986 3,093 8,553 11.55 26 Hermes International 4.119 279 1,478 6.8% 35.297 41 1,481 22.91 27 LVMH Moet Hennessy 30.638 1,848 7,027 2.1% 80,731 9,243 4,648 12.14 28 Prada 3,552 362 954 1.9% 8,772 519 720 8.98 29 Tiffany & Co. 3,248 189 819 4.7% 9,125 989 648 11.56 30 Average 12.74 EUR 8,643.09 EUR 7,841.70 31 Figures as of end of 2014, except Equity Value which is as of October 2015. Meclian 11.56 EUR 2,300.00 -EUR 2,300.00 32 Projected growth rate is equal to the 5 year compound annual growth rate of Operating profits from 2014 actuals to 2019 forecast. EUR 6,343.09 EUR 5,541.70 33 EUR 33.56 EUR 29.32 34 Source: FactSet; The projected growth rate is obtained based on the Value Line Investment Survey (August-October 2015) and Case writer esti $ 38.18 $ 33.35 35 Mean Median 36 3.1% 37 20 D E G M N 0 P R T U V w X 2015 7.0% 5.0% 3.0% 3.0% 2016 5.0% 5.0% 3.0 6.0% 2017 4.0% 5.0% 3.0% 6.0% 2018 4.0% 5.0% 3.0% 6.0% 2019 3.0% 5.0% 3.0% 6.0% 13.0 10.09 25.0% 13.5% 10.0% 27.0% 14.0% 10.0% 28.0% 14.0% 10.0% 30.0% 14.0% 10.0% 30.0% 2.2 2.2 2.2 2.0 3.2 34% 2.1 3.3 34% 3.5 34% 3.7 34% 3.8 34% A B 1 Exhibit 8 2 FERRARI: THE 2015 INITIAL PUBLIC OFFERING 3 Ferrari Forecast Millions of Euro, except as noted) 4 5 Assumptions 2014 6 Growth in Cars Shipped 3.6% 7 Growth in Revenue/Car 8 Growth in Engine Revenue 9 Growth in Other Revenue 10 11 Operating Margin - Cars 12.5% 12 Operating Margin - Engines 9.1% 13 Operating Margin - All Other Revenue 24.9% 14 15 Net Working Capital Turnover 1.9 16 Net Fixed Asset Turnover 3.2 17 Deprec. & Amort./PP&E 34% 18 19 Financial Forecast 20 Car Shipments (000s) 7.26 21 Avg Revenue per Car (Euro 000s) 268 22 Car Revenue 1,944 23 Engine Revenue 311 24 All Other Revenue 507 25 Total Revenue 2,762 26 27 Operating Profit - Cars 243 28 Operating Profit - Engines 28 29 Operating Profit - All Other Revenue 126 30 Total Operating Profit 398 31 32 Net Working Capital 1,425 33 Net PP&E and Int. Assets 851 34 Deprec. & Amort. 289 35 36 Total Revenue Growth 18% 37 EBITDA Margin 25% 38 39 Source: Case Writer Estimates 40 8.15 295 7.76 281 2.184 320 523 3,027 2,408 8.48 310 2,629 340 587 3,556 8.82 326 2,871 350 9.08 342 3,105 361 660 4,126 330 554 3,292 623 3,844 284 32 131 447 325 33 150 508 368 34 164 567 402 35 187 624 435 36 198 669 1,513 932 317 1,568 998 339 1,617 1,016 345 1,747 1,039 353 1,875 1,086 369 10% 25% 9% 26% 8% 26% 8% 25% 70% 25% F G H > 1 J K L M N P 1 year A B D E 1 Exhibit 2 2 FERRARI: THE 2015 INITIAL PUBLIC OFFERING 3 Capital Markets Data - October 19, 2015 4 5 Government Bond Yields (Italy) 6 7 0.23% 8 10 year 1.70% 9 10 Corporate Bonds 11 Euro 12 AAA 1.91% 13 AA 1.99% 14 A 2.30% 15 BBB 3.43% 16 BB 4.98% 17 B 6.79% 18 19 20 Exchange Rate USD/EUR 1.1375 21 22 23 Source: ADB Analisi Data Borsi, Merrill Lynch, Case Writer Estimates 24 F G H M N O R S U V w X AA B E 1 Exhibit 1 2 FERRARI: THE 2015 INITIAL PUBLIC OFFERING 3 Ferrari Car Shipments 4 5 Full Year 6 2012 2013 7 By Model Type 8 Sports Cars 9 V8 4,274 3,944 10 V12 481 1.401 11 4,755 First Half of Year 2014 2015 2014 3,651 1.565 2,077 900 1,581 645 2.226 Total 5,345 5,216 2,977 12 1,589 1.061 1,219 436 1,655 1,645 394 2,039 454 237 691 1,280 188 1,468 2,650 13 GT Cars 14 Vs 15 V12 16 Total 17 18 By Geography 19 Europe, Middle East, and Africa 20 United Kingdom 21 Germany 22 Switzerland Italy 24 France 25 Middle East 26 Rest of EMEA 27 Total EMEA 686 755 366 318 330 423 825 3,703 686 659 350 206 273 472 663 3,309 705 616 332 243 253 521 604 3,274 408 353 181 132 138 232 342 1,793 456 214 155 139 129 185 320 1,598 28 Americas Americas 29 2.208 2382 2,462 1,199 1,287 30 31 32 33 Asia Pacific Greater China Rest of APAC Total APAC 789 705 1,494 572 737 1,309 675 844 1,519 289 387 676 261 548 809 34 Total 7,405 7,000 7,255 3,668 3,694 35 36 37 38 20 Middle East includes the United Arab Emirates, Saudi Arabia, Bahrain, Lebanon, Qatar, Oman and Kuwait Rest of EMEA includes Africa and the other European markets 110t separately identified. Americas includes the United States of America, Canada, Mexico, the Caribbean and Central and South America - E F G N P Q R T U V W Z AA AB AC 4A 1 Exhibit 3 2 FERRARI: THE 2015 INITIAL PUBLIC OFFERING 3 Ferrari Income Statement millions of euro) 4 5 First Half 2015 6 2012 2013 2014 7 8 Sales Cars and Spare Parts (1) Engines (2) Sponsorship, Commercial and Brand (3) 1,695 77 385 69 2005 9 10 11 12 1,655 188 412 80 2.335 1,944 311 417 91 2,762 1,007 121 212 Other 4 Total Sales 1,387 13 14 Cost of Sales excluding Dep. and Amort. Depreciation and Amortization Expense Selling, General, and Admin. Espense Research and Development Other Operating Espense Operating Income (EBIT) EBITDA 961 238 243 431 17 335 15 964 270 260 479 -2 364 33******* 1,217 289 300 541 26 389 678 592 130 152 291 16 # 17 18 19 218 20 21 22 23 24 25 26 27 Net Financial Income Expense) Profit before Tax Income Tax Espense Net Profit -1 335 101 233 3 366 120 246 2 398 133 265 191 65 126 Capital Espenditures 258 271 330 151 28 29 30 (1) Includes the net revenues generated from shipments of ous cars, including any personalization revenue generated on these cars and sales of space parts. (2) Includes the net revenues genecated from the sale of engines to Maserati for use in their cars, and the Levenues genecated from the rental of engines to other Fomula 1 cacing teams (3) Includes the net revenues eamed by our Fomula 1 racing team through sponsorship agreements and our share of the Formula 1 World Championship commercial cevenues and net revenues generated through the Ferraci brand, including merchandising licensing and (4) Primarily includes interest income generated by the Ferrari Financial Services group and net revenues from the management of the Mugello cacetrack. 33 34 Source: Company Prospectus 31 32 G H K L M N 10.22% 12% 14% WACC 8% 0% 2.25% 49% 6% 238 Growth 585 C 1 Exhibit 4 2 FERRARI: THE 2015 INITIAL PUBLIC OFFERING 3 Ferrari Balance Sheet (millions of euro) 4 5 31-Dec-2013 31-Dec-2014 30-Jun-2015 6 Cash and cash equivalents 798 1,077 258 7 Trade receivables 206 184 154 8 Receivables from financing activities 863 1,224 1,181 9 Inventories 296 352 10 Other current assets 115 64 100 11 Total current assets 2,219 2,845 2,045 12 Investments and other financial asse 37 47 48 13 Deferred tax assets 42 112 149 14 Property, plant, and equipment 568 589 15 Intangible assets (1) 265 283 16 Goodwill 787 787 787 17 Total assets 3,895 4,641 3,900 18 19 Trade payables 486 536 578 20 Current tax payables 104 110 182 21 Other current liabilities 475 774 836 22 Total current liabilities 1,065 1,420 1,595 23 Long-term debt 317 510 2,267 24 Other liabilities 197 239 25 Total equity 2.316 2,478 -201 26 Total liabilities and equity 3,895 4,641 3,900 27 (1) Costs incurred for car project development are recognized as as asset following the conditions of IAS38. Capitalized development costs are amortized on a straight-line 28 basis over the estimated life of the model (generally 4 to 8 years). 242 233 A B D E F G H J K L M N Nm 0 m 2014 1 Exhibit 5 2 FERRARI: THE 2015 INITIAL PUBLIC OFFERING 3 FCA Car Shipments by Brand (000s of units) 4 5 6 2013 7 Mass-Market Vehicle Brands 8 NAFTA (U.S., Canada, Mexico) 2,100 9 LATAM (Latin America) 900 10 APAC (Asia Pacific) 200 11 EMEA (Europe, Middle East, Africa) 1,100 12 Total 4,300 2,500 800 300 1,200 4,800 13 14 Maserati 20 40 15 Ferrari 7 7 16 17 Mass-market Brands: Abarth, Alfa Romeo, Chrysler, Dodge, Fiat, Fiat Professional, Jeep, Lancia, and Ram. 18 19 Source: FCA Annual Report 20 21 22 G H J M N 0 Q R S T U w X D 1 Exhibit 6 2 FERRARI: THE 2015 INITIAL PUBLIC OFFERING 3 Data for Comparable Companies in millions of euros) 4 5.647 Total Capital Projected Market Value Total 5 Revenue Espend EBITDA Growth Rate of Equity Debt Cash EV/EBITDA 6 Auto Manufacturers 7 BMW 80,401 6,099 16,426 6.1% 56,562 77,506 7,688 7.69 8 Daimler 129,872 6,307 18,514 6.9% 77,906 86,689 15,543 8.05 9 Fiat Chrvsler 96.090 8,121 8,271 4.6% 18,657 33,724 23,601 3.48 10 Ford Motor 108,619 5,626 8.537 10.1% 52,925 98,484 25,743 14,72 11 General Motors 117,554 8,946 6,674 4.5% 46,554 38,710 24,391 9.12 12 Honda Motor 96,196 6,374 12,730 6.9% 51,128 52,483 11,427 7.24 13 Hyundai Motor 63,924 3,385 7,233 6.8% 33,631 40.802 19,547 7.59 14 Kia Motors 33,730 1,446 2.800 1.6% 16,977 3,535 5,502 5.36 15 Nissan Motor 82,101 11,432 10,879 6.2 40,013 51,796 6,698 7.82 16 Peugeot 53,607 2,428 3,318 7.0% 12.230 21,914 10.521 7.12 17 Renault 41,055 2,703 3,967 8.9% 23,096 36,299 14,049 11.43 18 Tata Motors 33,811 4,100 5.5% 16,701 10,952 7,125 3.64 19 Tesla Motors 2,411 731 9 94.9% 26,400 2,051 1,590 3,114.03 20 Tovota Motor 196,622 24.233 30,260 3.2% 186,069 147,344 40,497 9.68 21 Volkswagen 202,458 16,613 23,048 3.5% 52,916 139,021 34,143 6.85 22 23 Luxury Brands 24 Burberry Group 3.221 199 745 2.6% 7,691 90 865 9.28 25 Cie Financiere Richemont 10,410 708 2,902 38,986 3,093 8,553 11.55 26 Hermes International 4.119 279 1,478 6.8% 35.297 41 1,481 22.91 27 LVMH Moet Hennessy 30.638 1,848 7,027 2.1% 80,731 9,243 4,648 12.14 28 Prada 3,552 362 954 1.9% 8,772 519 720 8.98 29 Tiffany & Co. 3,248 189 819 4.7% 9,125 989 648 11.56 30 Average 12.74 EUR 8,643.09 EUR 7,841.70 31 Figures as of end of 2014, except Equity Value which is as of October 2015. Meclian 11.56 EUR 2,300.00 -EUR 2,300.00 32 Projected growth rate is equal to the 5 year compound annual growth rate of Operating profits from 2014 actuals to 2019 forecast. EUR 6,343.09 EUR 5,541.70 33 EUR 33.56 EUR 29.32 34 Source: FactSet; The projected growth rate is obtained based on the Value Line Investment Survey (August-October 2015) and Case writer esti $ 38.18 $ 33.35 35 Mean Median 36 3.1% 37 20 D E G M N 0 P R T U V w X 2015 7.0% 5.0% 3.0% 3.0% 2016 5.0% 5.0% 3.0 6.0% 2017 4.0% 5.0% 3.0% 6.0% 2018 4.0% 5.0% 3.0% 6.0% 2019 3.0% 5.0% 3.0% 6.0% 13.0 10.09 25.0% 13.5% 10.0% 27.0% 14.0% 10.0% 28.0% 14.0% 10.0% 30.0% 14.0% 10.0% 30.0% 2.2 2.2 2.2 2.0 3.2 34% 2.1 3.3 34% 3.5 34% 3.7 34% 3.8 34% A B 1 Exhibit 8 2 FERRARI: THE 2015 INITIAL PUBLIC OFFERING 3 Ferrari Forecast Millions of Euro, except as noted) 4 5 Assumptions 2014 6 Growth in Cars Shipped 3.6% 7 Growth in Revenue/Car 8 Growth in Engine Revenue 9 Growth in Other Revenue 10 11 Operating Margin - Cars 12.5% 12 Operating Margin - Engines 9.1% 13 Operating Margin - All Other Revenue 24.9% 14 15 Net Working Capital Turnover 1.9 16 Net Fixed Asset Turnover 3.2 17 Deprec. & Amort./PP&E 34% 18 19 Financial Forecast 20 Car Shipments (000s) 7.26 21 Avg Revenue per Car (Euro 000s) 268 22 Car Revenue 1,944 23 Engine Revenue 311 24 All Other Revenue 507 25 Total Revenue 2,762 26 27 Operating Profit - Cars 243 28 Operating Profit - Engines 28 29 Operating Profit - All Other Revenue 126 30 Total Operating Profit 398 31 32 Net Working Capital 1,425 33 Net PP&E and Int. Assets 851 34 Deprec. & Amort. 289 35 36 Total Revenue Growth 18% 37 EBITDA Margin 25% 38 39 Source: Case Writer Estimates 40 8.15 295 7.76 281 2.184 320 523 3,027 2,408 8.48 310 2,629 340 587 3,556 8.82 326 2,871 350 9.08 342 3,105 361 660 4,126 330 554 3,292 623 3,844 284 32 131 447 325 33 150 508 368 34 164 567 402 35 187 624 435 36 198 669 1,513 932 317 1,568 998 339 1,617 1,016 345 1,747 1,039 353 1,875 1,086 369 10% 25% 9% 26% 8% 26% 8% 25% 70% 25% F G H > 1 J K L M N P 1 year A B D E 1 Exhibit 2 2 FERRARI: THE 2015 INITIAL PUBLIC OFFERING 3 Capital Markets Data - October 19, 2015 4 5 Government Bond Yields (Italy) 6 7 0.23% 8 10 year 1.70% 9 10 Corporate Bonds 11 Euro 12 AAA 1.91% 13 AA 1.99% 14 A 2.30% 15 BBB 3.43% 16 BB 4.98% 17 B 6.79% 18 19 20 Exchange Rate USD/EUR 1.1375 21 22 23 Source: ADB Analisi Data Borsi, Merrill Lynch, Case Writer Estimates 24
Step by Step Solution
There are 3 Steps involved in it
Step: 1

Get Instant Access to Expert-Tailored Solutions
See step-by-step solutions with expert insights and AI powered tools for academic success
Step: 2

Step: 3
Ace Your Homework with AI
Get the answers you need in no time with our AI-driven, step-by-step assistance
Get Started
Personal Financial Planning For Executives And Entrepreneurs
Authors: Michael J. Nathanson, Jeffrey T. Craig, Jennifer A. Geoghegan, Nadine Gordon Lee, Michael A. Haber, Seth P. Hieken, Matthew C. Ilteris, D. Scott McDonald, Joseph A. Salvati, Stephen R. Stelljes
1st Edition
3030405273, 978-3030405274