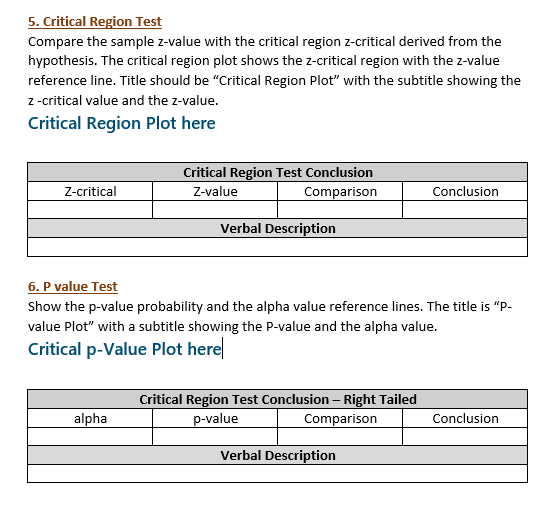
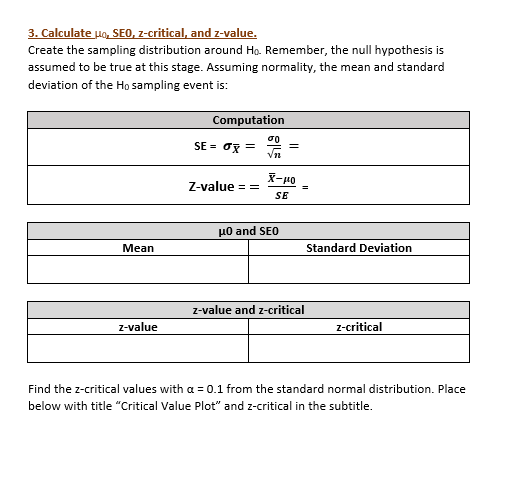
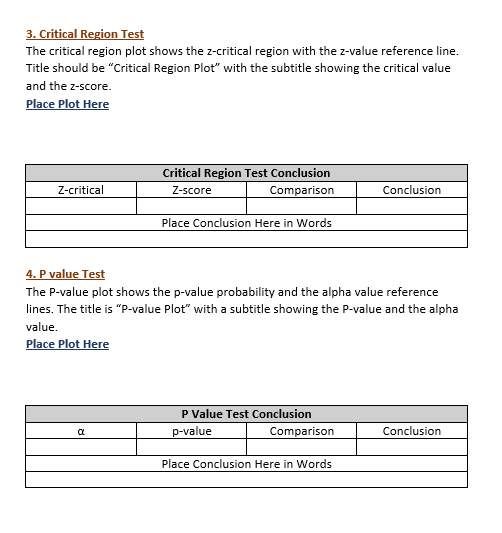
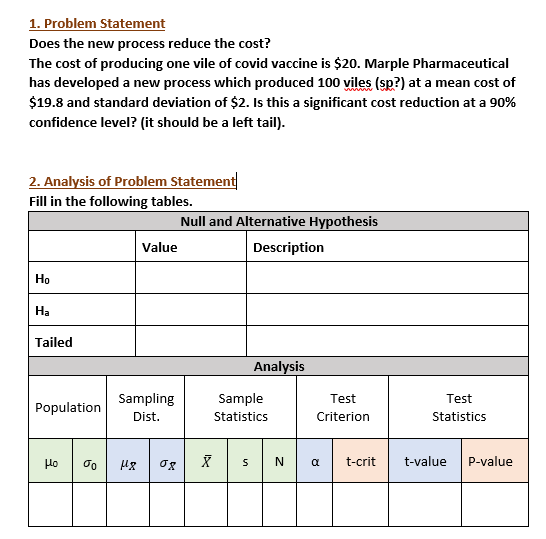
\f\f5. Critical Region Test Compare the sample z-value with the critical region z-critical derived from the hypothesis. The critical region plot shows the z-critical region with the z-value reference line. Title should be "Critical Region Plot" with the subtitle showing the z -critical value and the z-value. Critical Region Plot here Critical Region Test Conclusion Z-critical Z-value Comparison Conclusion Verbal Description 6. P value Test Show the p-value probability and the alpha value reference lines. The title is "p- value Plot" with a subtitle showing the P-value and the alpha value. Critical p-Value Plot here Critical Region Test Conclusion - Right Tailed alpha p-value Comparison Conclusion Verbal Description\f3. Calculate pa. BED. z-oritical. and z-ualue. Create the sampling distribution around He. Remember, the null hypothesis is assumed to be true at this stage. Assuming normality; the mean and standard deviation ofthe H a sampling event is: Find the zcritical values with E = I11 from the standard normal distribution. Place below with title "Critical 'ul'alue Plot" and z-critical in the subtitle. 3. Critical Region Test The critical region plot shows the z-critical region with the z-value reference line. Title should be "Critical Region Plot" with the subtitle showing the critical value and the z-score. Place Plot Here Critical Region Test Conclusion Z-critical z-score Comparison Conclusion Place Conclusion Here in Words 4. P value Test The P-value plot shows the p-value probability and the alpha value reference lines. The title is "P-value Plot" with a subtitle showing the P-value and the alpha value. Place Plot Here P Value Test Conclusion a p-value Comparison Conclusion Place Conclusion Here in Words\f1. Problem Statement Does the new process reduce the cost? The cost of producing one vile of covid vaccine is $20. Marple Pharmaceutical has developed a new process which produced 100 viles (sp?) at a mean cost of $19.8 and standard deviation of $2. Is this a significant cost reduction at a 90% confidence level? (it should be a left tail). 2. Analysis of Problem Statement Fill in the following tables. Null and Alternative Hypothesis Value Description Ho Ha Tailed Analysis Sampling Sample Test Test Population Dist. Statistics Criterion Statistics Ho S N t-crit t-value P-value3. Calculate po, SEO, t-critical, and t-value. Create the sampling distribution around Ho. Remember, the null hypothesis is assumed to be true at this stage. Assuming normality, the mean and standard deviation of the Ho sampling event is: Computation SE = OX = SE = s = t-value = = X-HO = SE HO and SEO Mean Standard Deviation t-value and t-critical t-value t-critical Use the t distribution with DF = n-1 and a = 0.1 cut off point depending on the tailedness, left, right, or middle. Place t-critical plot here. Title "t-critical" subtitle contains the DF and t-critical value.IL Critical Region Test The critical region plot shows the tcritical region with the tvelue referenoe line. Title should be "Critical Region Plot" with the subtitle showing the critical value and the tvalue. Place Plot Here IIEritical Region Test conclusion Tcritical Cnnclusion 5. P value Test The P-velue plot shows the pvalue probabilitv and the alpha value reference lines. The title is "Pvelue Plot" with a subtitle showing the Pvalue and the alpha value. Place Plot Here P Value Test Conclusion Cnnclusion \f\f