Answered step by step
Verified Expert Solution
Question
1 Approved Answer
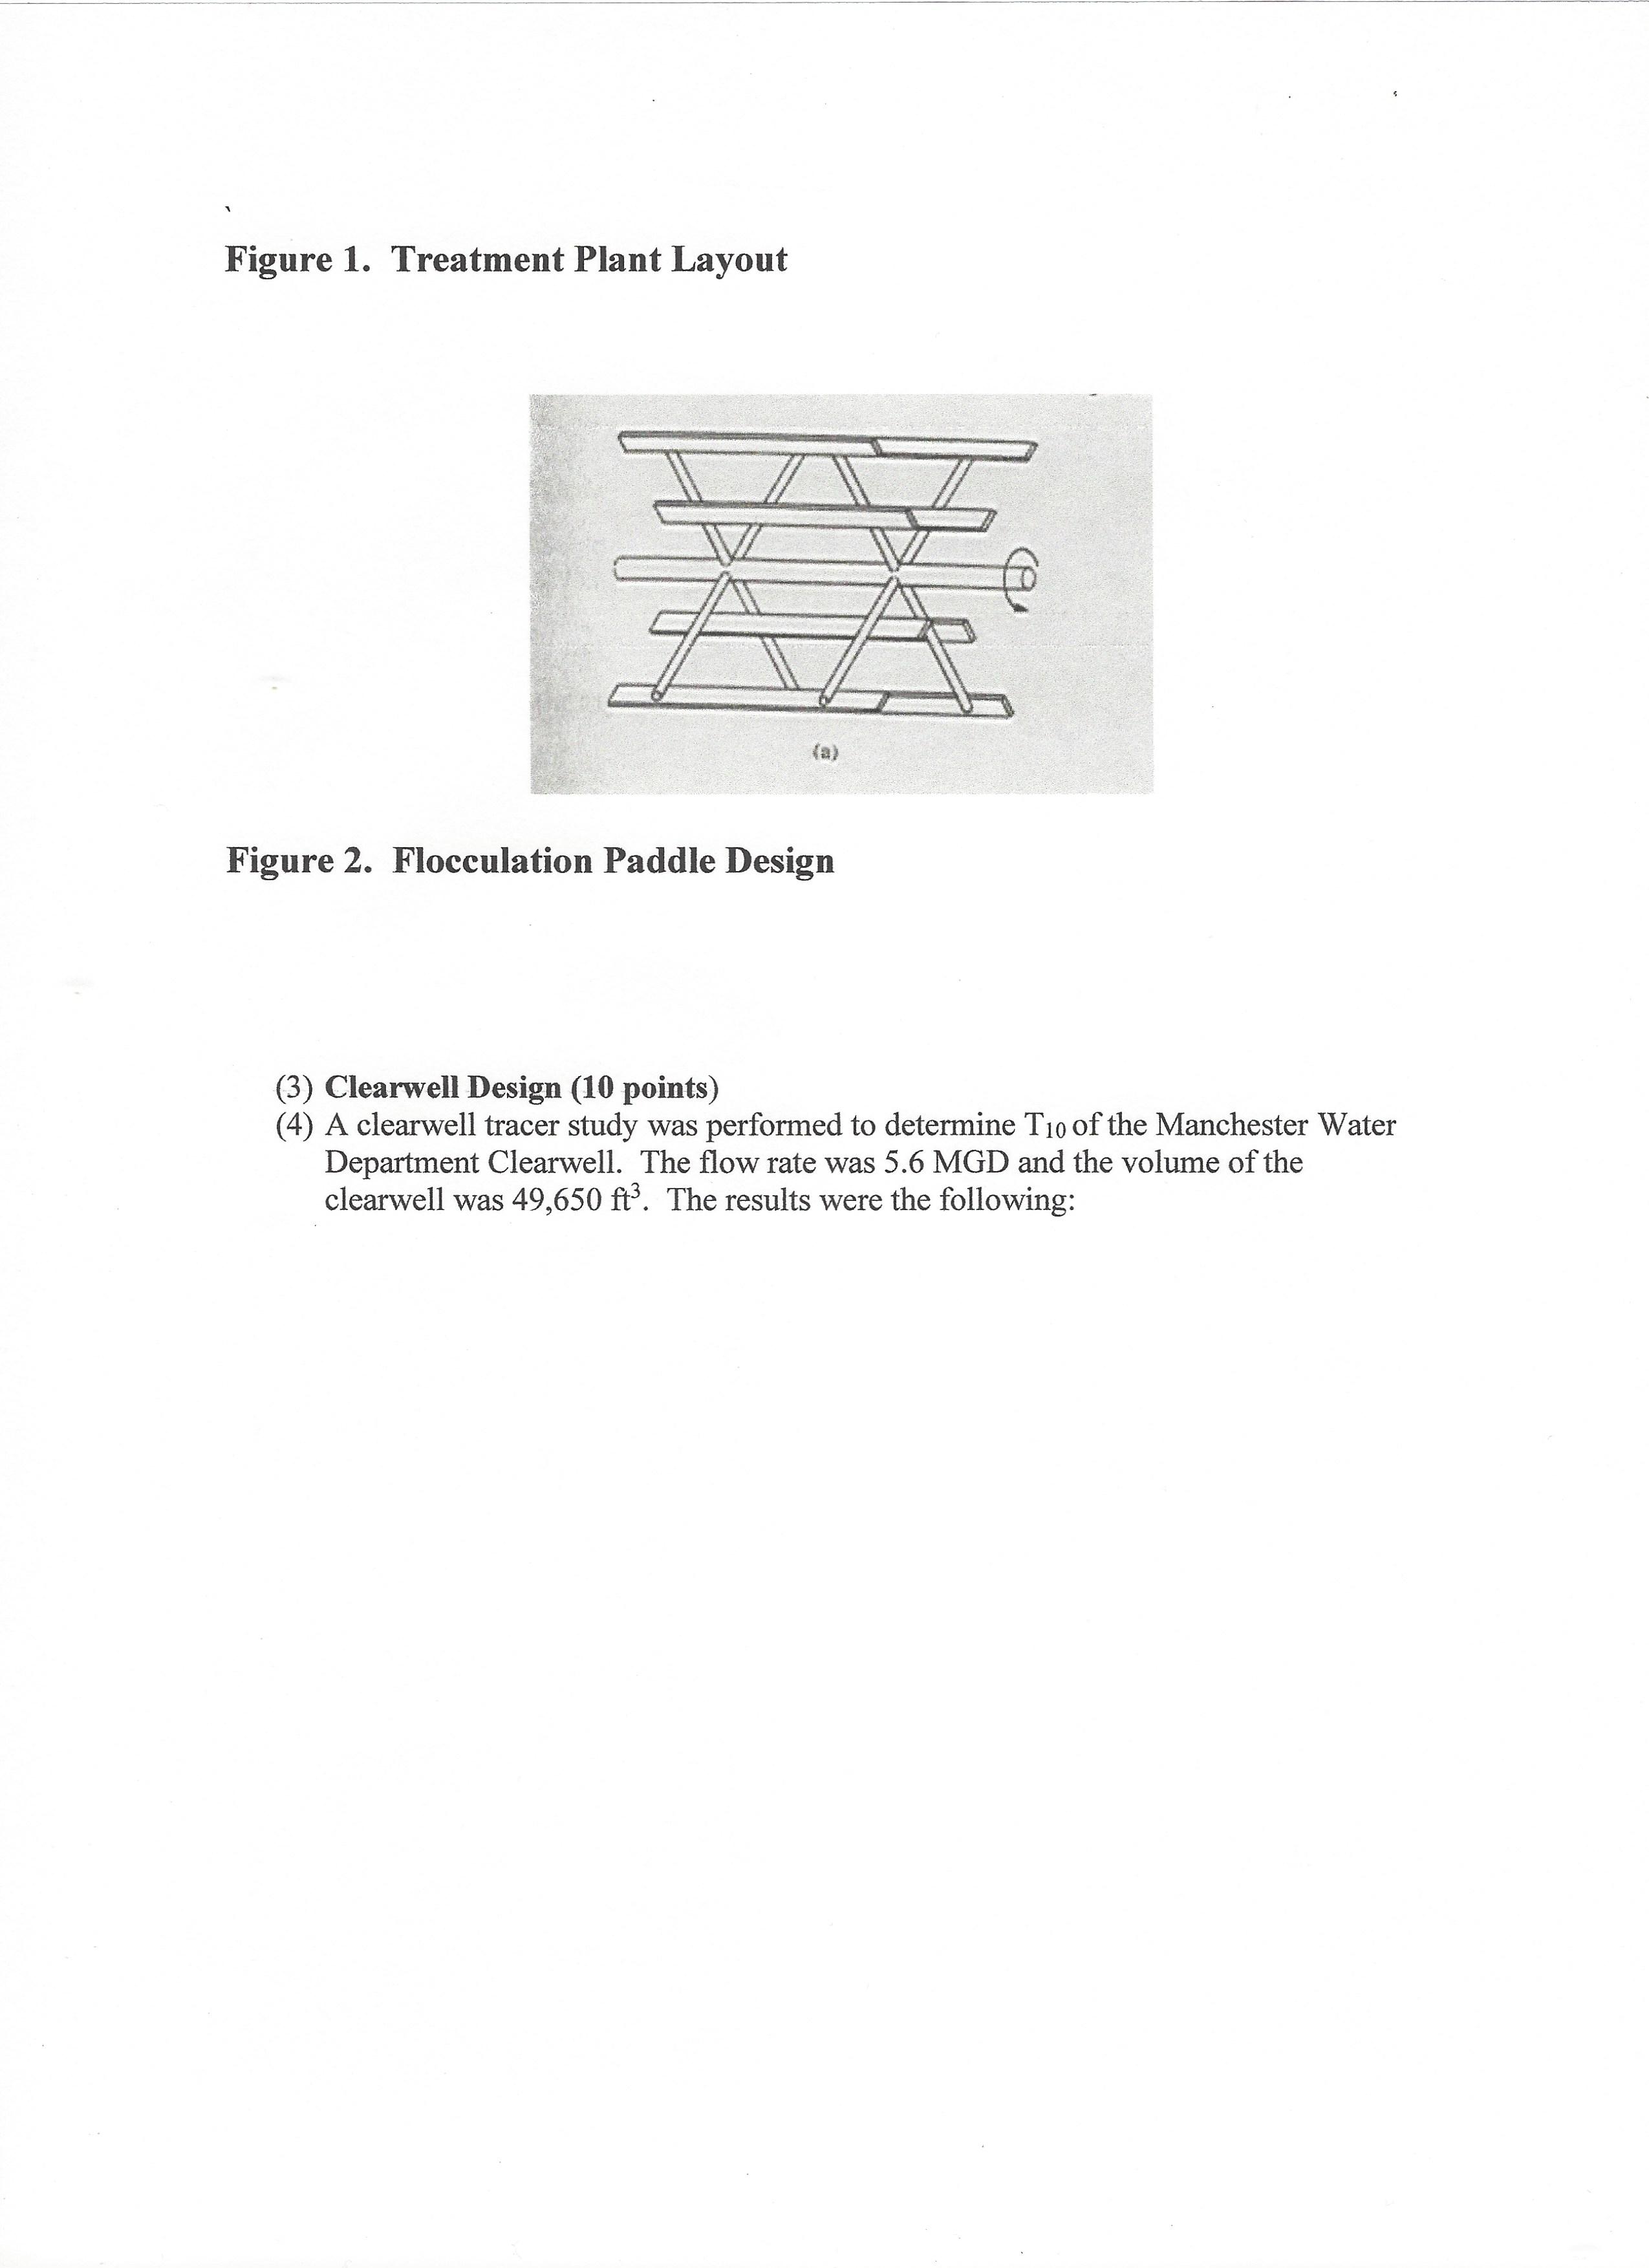
Figure 1. Treatment Plant Layout Figure 2. Flocculation Paddle Design (3) Clearwell Design (10 points) (4) A clearwell tracer study was performed to determine


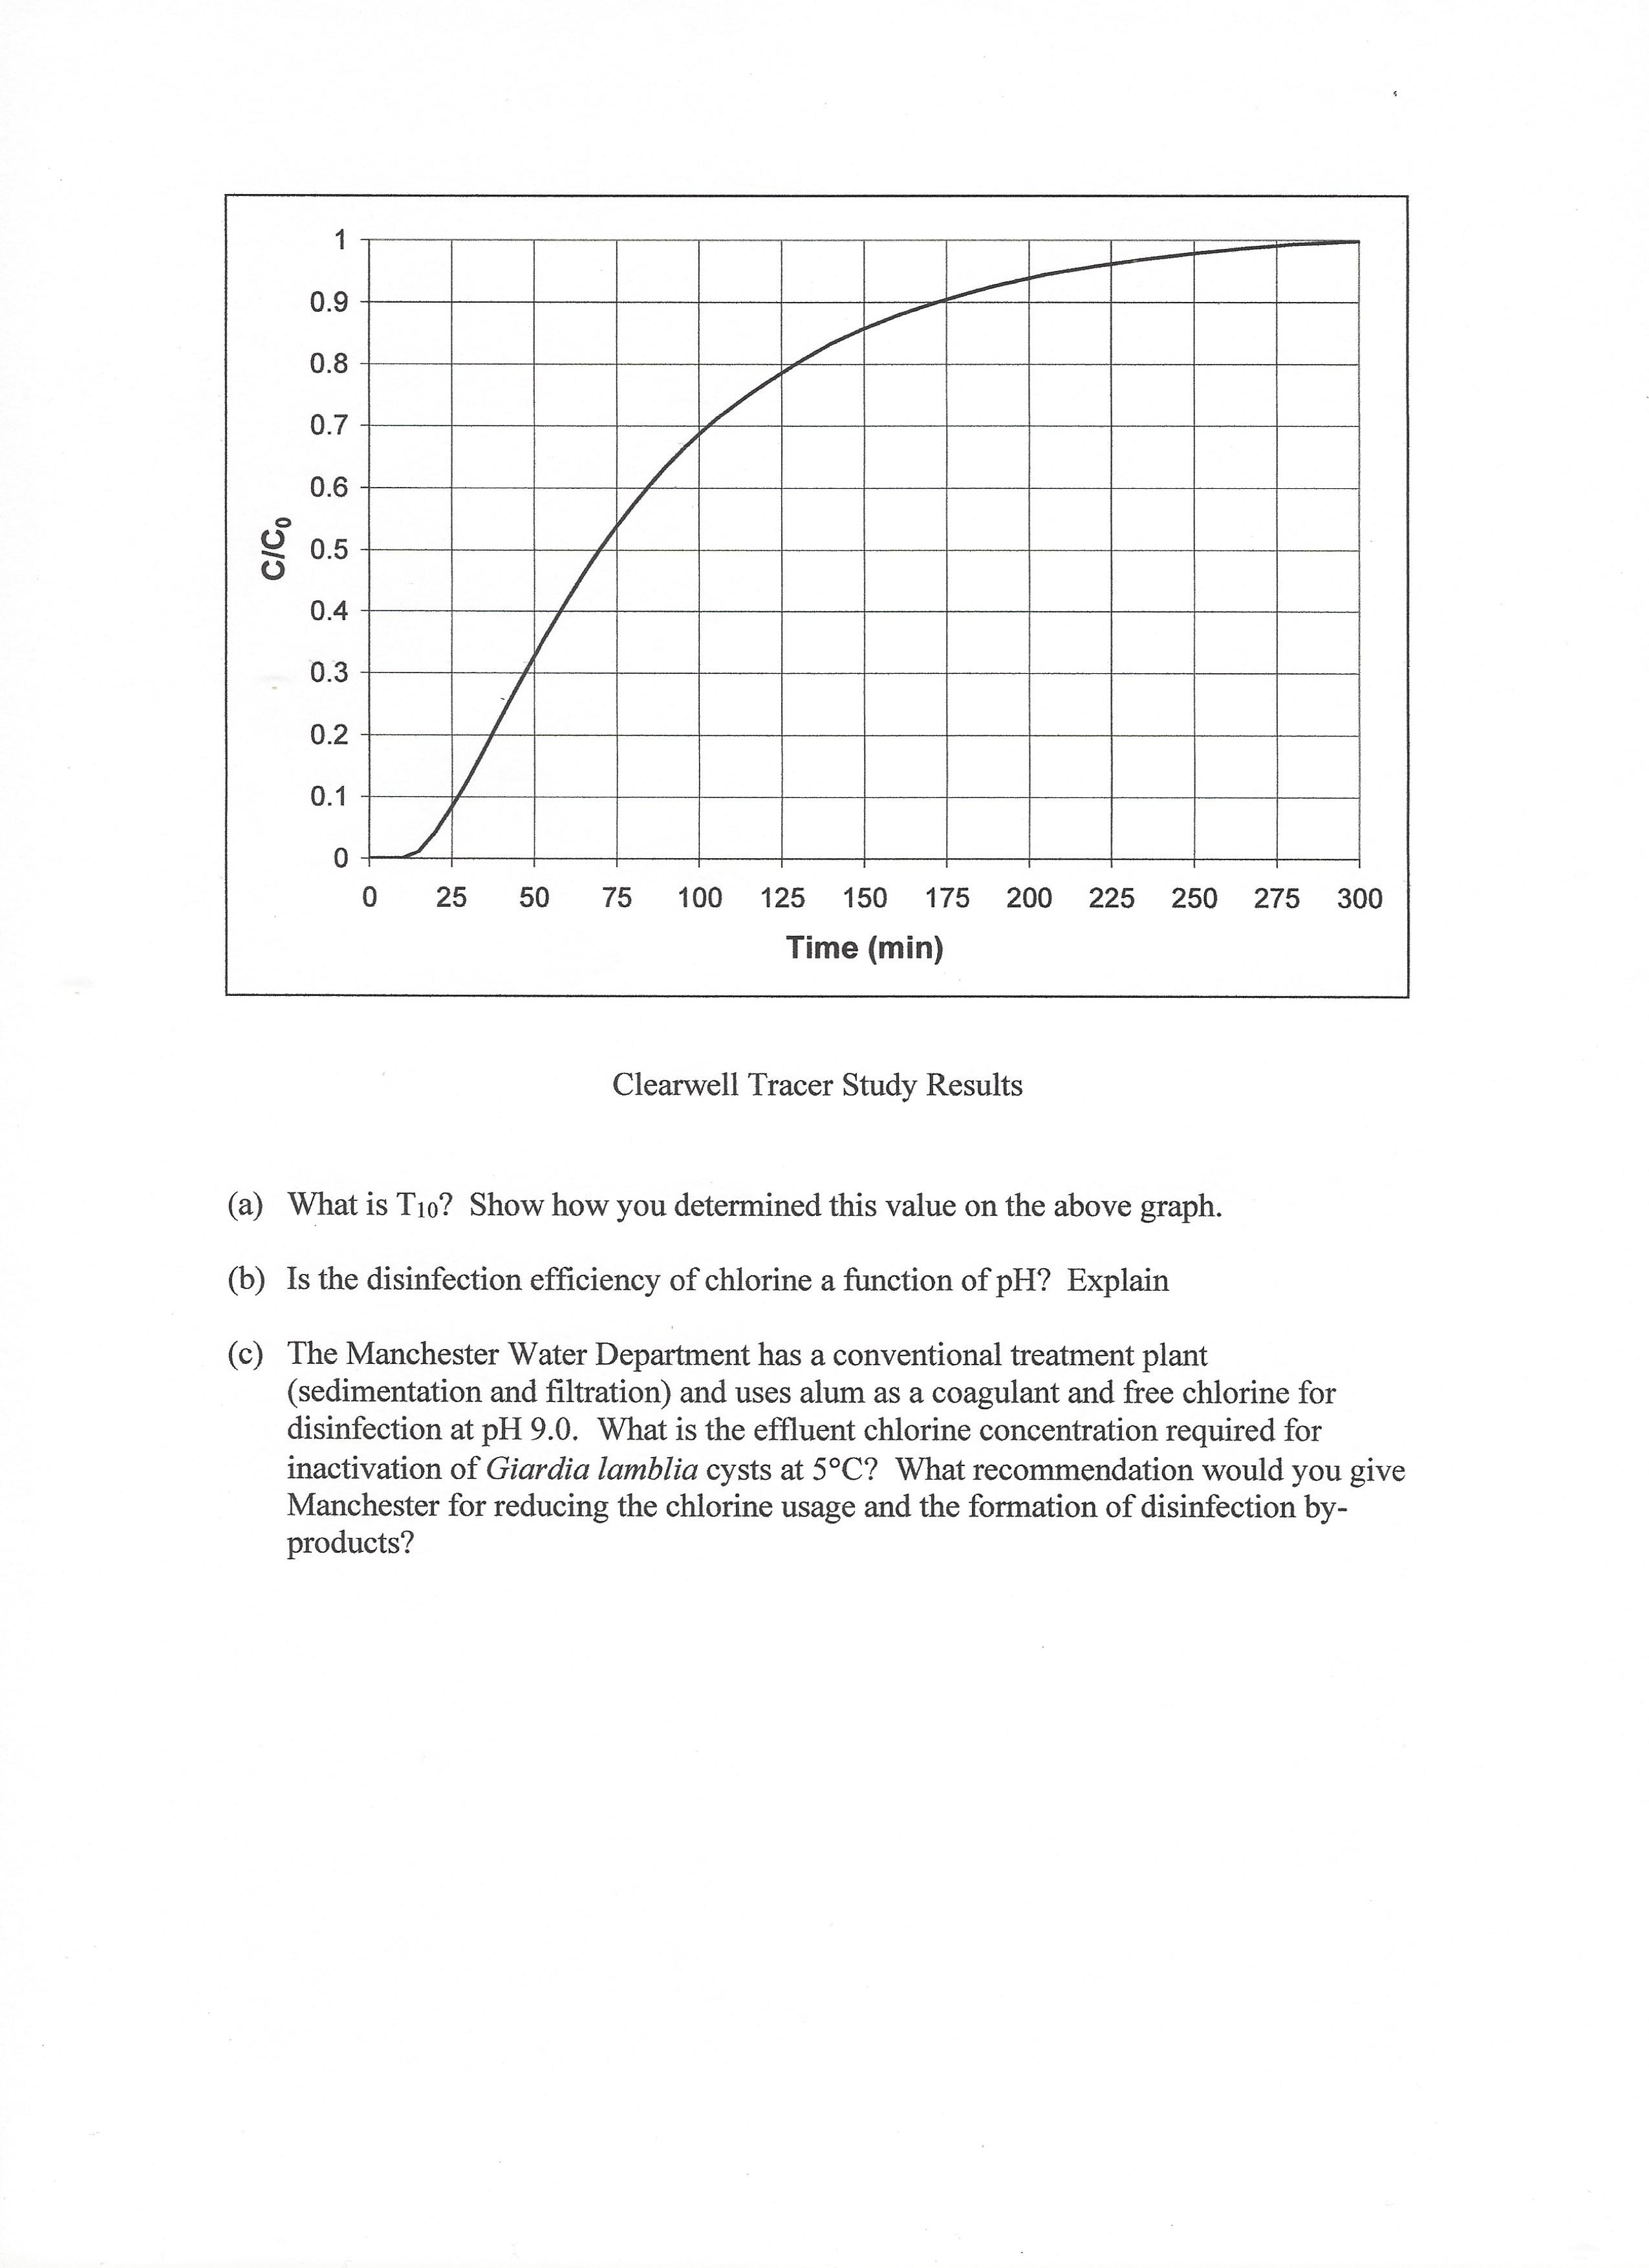
Figure 1. Treatment Plant Layout Figure 2. Flocculation Paddle Design (3) Clearwell Design (10 points) (4) A clearwell tracer study was performed to determine T10 of the Manchester Water Department Clearwell. The flow rate was 5.6 MGD and the volume of the clearwell was 49,650 ft. The results were the following: C/CO 1 0.9 0.8 0.7 0.6 0.5 0.4 0.3 0.2 0.1 0 0 25 50 75 100 125 150 175 Time (min) 200 225 250 275 300 Clearwell Tracer Study Results (a) What is T10? Show how you determined this value on the above graph. (b) Is the disinfection efficiency of chlorine a function of pH? Explain (c) The Manchester Water Department has a conventional treatment plant (sedimentation and filtration) and uses alum as a coagulant and free chlorine for disinfection at pH 9.0. What is the effluent chlorine concentration required for inactivation of Giardia lamblia cysts at 5C? What recommendation would you give Manchester for reducing the chlorine usage and the formation of disinfection by- products?
Step by Step Solution
There are 3 Steps involved in it
Step: 1
Calculate T10 Q 56 10 6 Flow rat...
Get Instant Access to Expert-Tailored Solutions
See step-by-step solutions with expert insights and AI powered tools for academic success
Step: 2

Step: 3

Ace Your Homework with AI
Get the answers you need in no time with our AI-driven, step-by-step assistance
Get Started


