Question
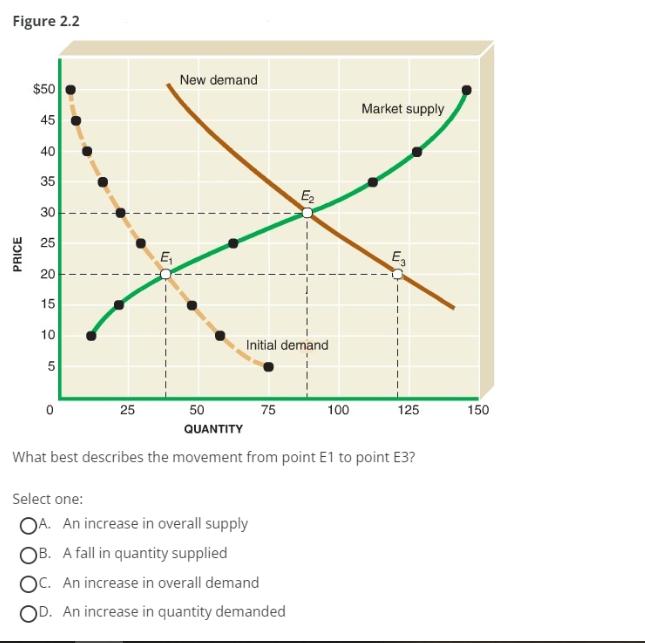
Figure 2.2 PRICE $50 45 40 35 30 25 20 15 10 5 0 25 E New demand Initial demand 75 E Select one:

Figure 2.2 PRICE $50 45 40 35 30 25 20 15 10 5 0 25 E New demand Initial demand 75 E Select one: OA. An increase in overall supply OB. A fall in quantity supplied OC. An increase in overall demand OD. An increase in quantity demanded 50 QUANTITY What best describes the movement from point E1 to point E3? 100 Market supply E 125 150
Step by Step Solution
3.42 Rating (161 Votes )
There are 3 Steps involved in it
Step: 1
The detailed answer for the above question is provided below Based on the given information the best ...
Get Instant Access to Expert-Tailored Solutions
See step-by-step solutions with expert insights and AI powered tools for academic success
Step: 2

Step: 3

Ace Your Homework with AI
Get the answers you need in no time with our AI-driven, step-by-step assistance
Get StartedRecommended Textbook for
Microeconomics
Authors: Dean S. Karlan, Jonathan J. Morduch
2nd edition
1259813337, 1259813339, 978-1259813337
Students also viewed these Economics questions
Question
Answered: 1 week ago
Question
Answered: 1 week ago
Question
Answered: 1 week ago
Question
Answered: 1 week ago
Question
Answered: 1 week ago
Question
Answered: 1 week ago
Question
Answered: 1 week ago
Question
Answered: 1 week ago
Question
Answered: 1 week ago
Question
Answered: 1 week ago
Question
Answered: 1 week ago
Question
Answered: 1 week ago
Question
Answered: 1 week ago
Question
Answered: 1 week ago
Question
Answered: 1 week ago
Question
Answered: 1 week ago
Question
Answered: 1 week ago
Question
Answered: 1 week ago
Question
Answered: 1 week ago
Question
Answered: 1 week ago
Question
Answered: 1 week ago
Question
Answered: 1 week ago
Question
Answered: 1 week ago
View Answer in SolutionInn App


