

Answered step by step
Verified Expert Solution
Question
1 Approved Answer
figure is also there 1. (12 pts) You are testing the amount of an analyte in a sample. To do so, you prepared a set
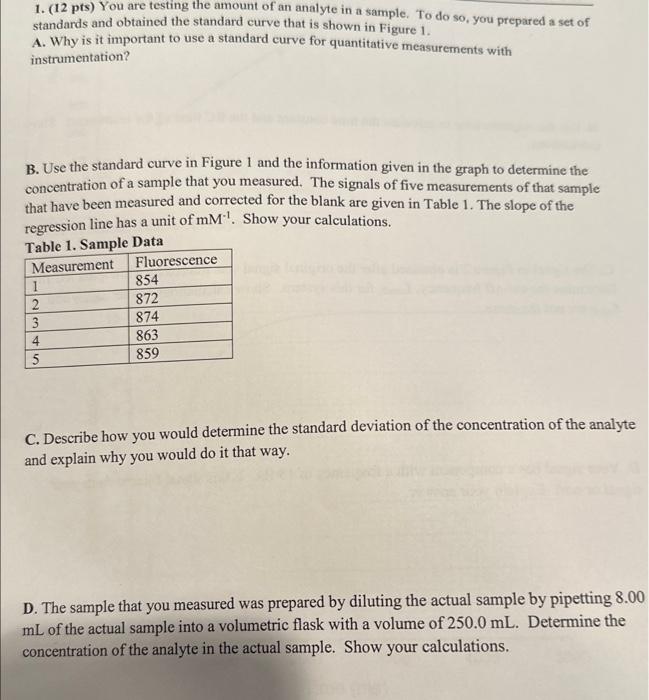
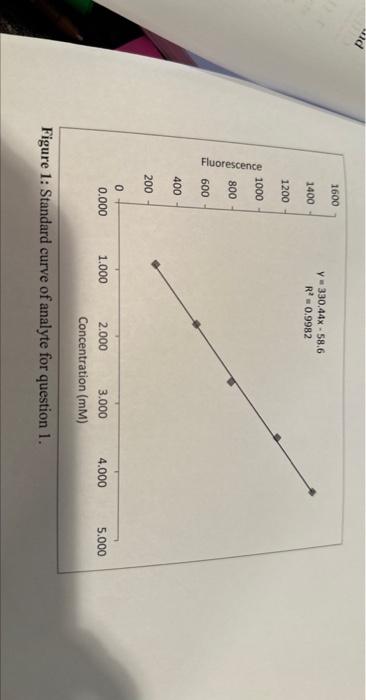
figure is also there
1. (12 pts) You are testing the amount of an analyte in a sample. To do so, you prepared a set of standards and obtained the standard curve that is shown in Figure 1. A. Why is it important to use a standard curve for quantitative measurements with instrumentation? B. Use the standard curve in Figure 1 and the information given in the graph to determine the concentration of a sample that you measured. The signals of five measurements of that sample that have been measured and corrected for the blank are given in Table 1. The slope of the regression line has a unit of mM1. Show your calculations. C. Describe how you would determine the standard deviation of the concentration of the analyte and explain why you would do it that way. D. The sample that you measured was prepared by diluting the actual sample by pipetting 8.00 mL of the actual sample into a volumetric flask with a volume of 250.0mL. Determine the concentration of the analyte in the actual sample. Show your calculations. Figure 1: Standard curve of analyte for question 1. 1. (12 pts) You are testing the amount of an analyte in a sample. To do so, you prepared a set of standards and obtained the standard curve that is shown in Figure 1. A. Why is it important to use a standard curve for quantitative measurements with instrumentation? B. Use the standard curve in Figure 1 and the information given in the graph to determine the concentration of a sample that you measured. The signals of five measurements of that sample that have been measured and corrected for the blank are given in Table 1. The slope of the regression line has a unit of mM1. Show your calculations. C. Describe how you would determine the standard deviation of the concentration of the analyte and explain why you would do it that way. D. The sample that you measured was prepared by diluting the actual sample by pipetting 8.00 mL of the actual sample into a volumetric flask with a volume of 250.0mL. Determine the concentration of the analyte in the actual sample. Show your calculations. Figure 1: Standard curve of analyte for question 1 Step by Step Solution
There are 3 Steps involved in it
Step: 1

Get Instant Access to Expert-Tailored Solutions
See step-by-step solutions with expert insights and AI powered tools for academic success
Step: 2

Step: 3
Ace Your Homework with AI
Get the answers you need in no time with our AI-driven, step-by-step assistance
Get Started
Fundamentals Of Biochemistry Life At The Molecular Level
Authors: Donald Voet, Judith G Voet, Charlotte W Pratt
5th Edition
1118918401, 9781118918401