

Question
Figure Q1 shows a 6level, 7x6 image. a. Apply histogram equalisation to the image of Figure Q1. How does the modified image look like? How
Figure Q1 shows a 6level, 7x6 image.
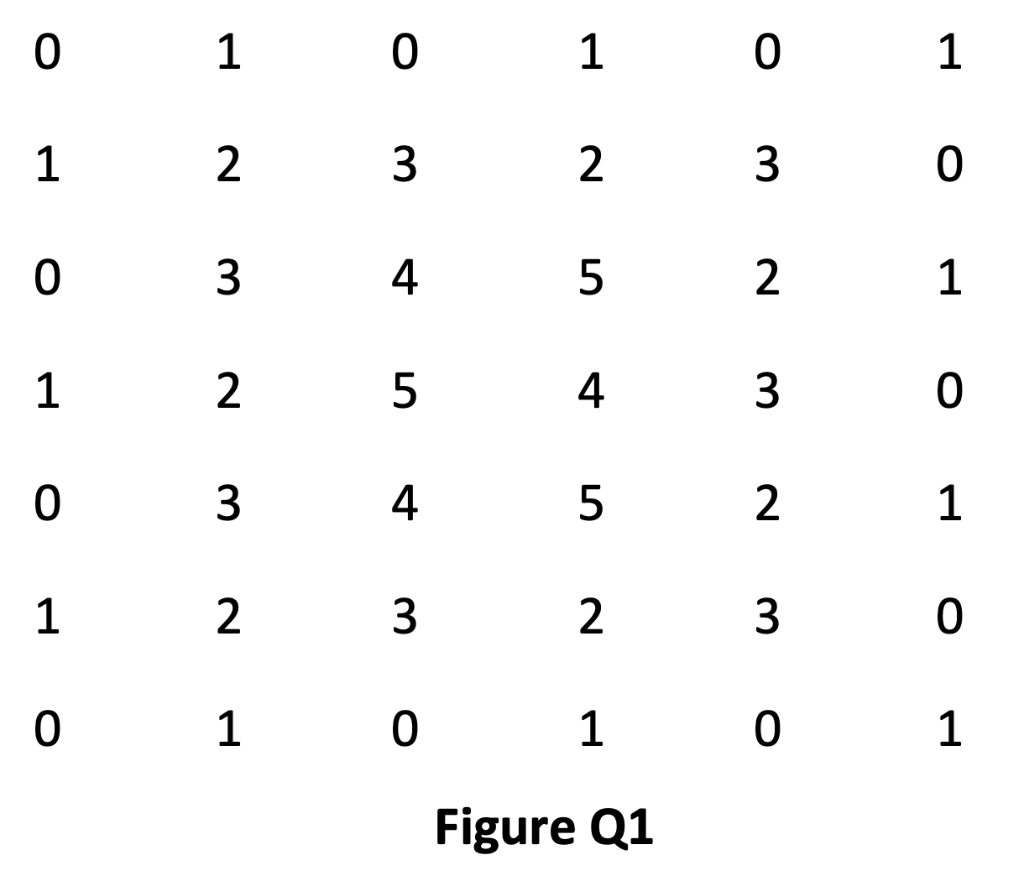
a. Apply histogram equalisation to the image of Figure Q1. How does the modified image look like? How many pixels of the original image have their intensity values changed?
b. Apply direct histogram specification to the image of Figure Q1, using the desired probability density function (pdf) of Table Q1. What does the transformed image look like?
| Level | 0 | 1 | 2 | 3 | 4 | 5 |
| 0 | 0.524 | 0 | 0.33 | 0 | 0.143 |
0 1 0 1 2 3 1 2 3 2 1 0 1 3 2 4 5 5 4 4 5 3 2 0 1 Figure Q1 0 3 2 3 2 3 0 0 1 0
Step by Step Solution
There are 3 Steps involved in it
Step: 1

Get Instant Access to Expert-Tailored Solutions
See step-by-step solutions with expert insights and AI powered tools for academic success
Step: 2

Step: 3
Ace Your Homework with AI
Get the answers you need in no time with our AI-driven, step-by-step assistance
Get Started
Administering Relational Databases On Microsoft Azure A Detail Paradigm To Support Sql On Azure Cloud And Dp 300 Study Guide
Authors: Prashanth Jayaram ,Ahmad Yaseen ,Rajendra Gupta
1st Edition
979-8706128029