Question
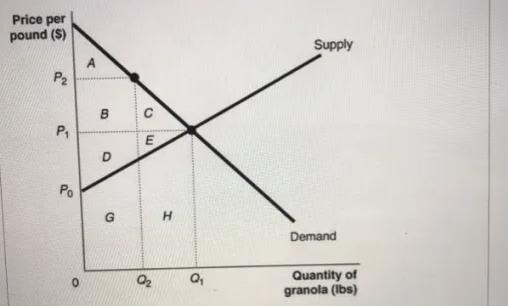
Figure shows the market for granola. The market is initially in equilibrium at a price of P1 and a quantity of Q1. Now suppose


Figure shows the market for granola. The market is initially in equilibrium at a price of P1 and a quantity of Q1. Now suppose producers decide to cut output to Q2 in order to raise the price to P2. Refer to Figure What area represents producer surplus at P? Price per pound ($) P P Po 0 A B D G C E H 0 Q Supply Demand Quantity of granola (lbs)
Step by Step Solution
There are 3 Steps involved in it
Step: 1
To find the surplus at a particular price in a graph representing demand and supply you need to iden...
Get Instant Access to Expert-Tailored Solutions
See step-by-step solutions with expert insights and AI powered tools for academic success
Step: 2

Step: 3

Ace Your Homework with AI
Get the answers you need in no time with our AI-driven, step-by-step assistance
Get StartedRecommended Textbook for
Microeconomics
Authors: Paul Krugman, Robin Wells
3rd edition
978-1429283427, 1429283424, 978-1464104213, 1464104212, 978-1429283434
Students also viewed these Economics questions
Question
Answered: 1 week ago
Question
Answered: 1 week ago
Question
Answered: 1 week ago
Question
Answered: 1 week ago
Question
Answered: 1 week ago
Question
Answered: 1 week ago
Question
Answered: 1 week ago
Question
Answered: 1 week ago
Question
Answered: 1 week ago
Question
Answered: 1 week ago
Question
Answered: 1 week ago
Question
Answered: 1 week ago
Question
Answered: 1 week ago
Question
Answered: 1 week ago
Question
Answered: 1 week ago
Question
Answered: 1 week ago
Question
Answered: 1 week ago
Question
Answered: 1 week ago
Question
Answered: 1 week ago
Question
Answered: 1 week ago
Question
Answered: 1 week ago
Question
Answered: 1 week ago
Question
Answered: 1 week ago
View Answer in SolutionInn App


