

Answered step by step
Verified Expert Solution
Question
1 Approved Answer
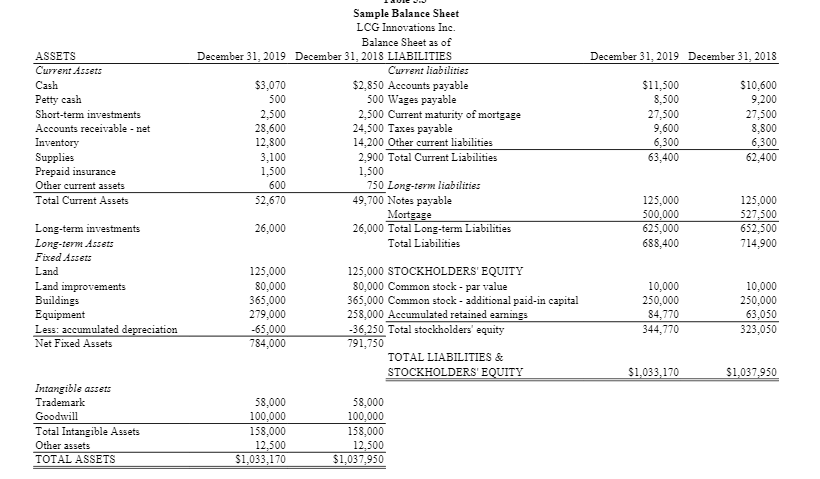
Fill in ratios in blue December 31, 2019 December 31, 2018 ASSETS Current Assets Cash Petty cash Short-term investments Accounts receivable - net Inventory Supplies
Fill in ratios in blue
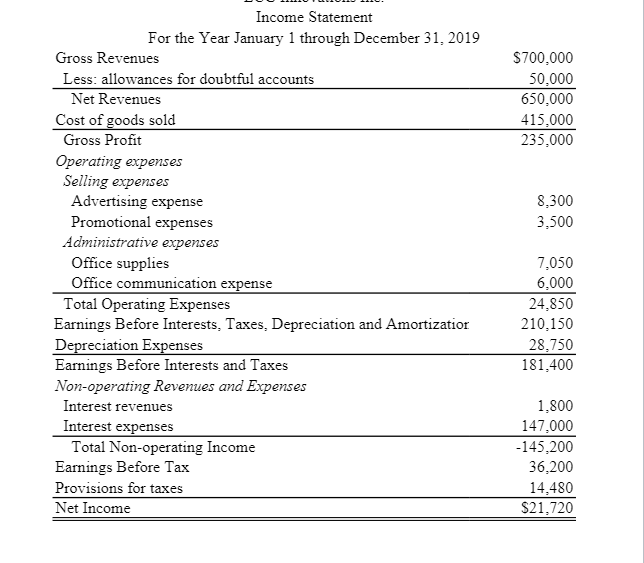
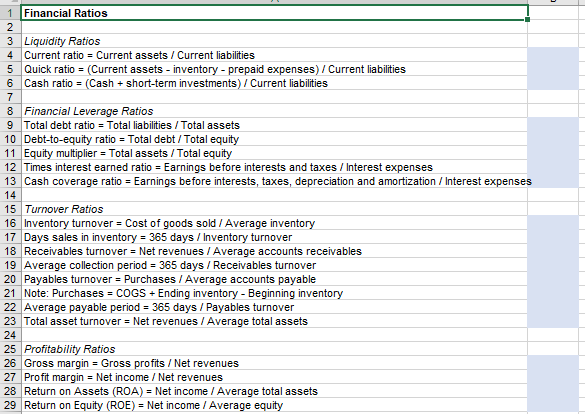
December 31, 2019 December 31, 2018 ASSETS Current Assets Cash Petty cash Short-term investments Accounts receivable - net Inventory Supplies Prepaid insurance Other current assets Total Current Assets Sample Balance Sheet LCG Innovations Inc. Balance Sheet as of December 31, 2019 December 31, 2018 LIABILITIES Current liabilities $3,070 $2,850 Accounts payable 500 500 Wages payable 2,500 2,500 Current maturity of mortgage 28,600 24,500 Taxes payable 12,800 14.200 Other current liabilities 3,100 2.900 Total Current Liabilities 1,500 1,500 600 750 Long-term liabilities 52.670 49,700 Notes payable Mortgage 26,000 26,000 Total Long-term Liabilities Total Liabilities $11,500 8,500 27,500 9,600 6,300 63,400 $10.600 9,200 27,500 8,800 6,300 62,400 125,000 500,000 625,000 688,400 125,000 527,500 652,500 714,900 Long-term investments Long-term Assets Fixed Assets Land Land improvements Buildings Equipment Less: accumulated depreciation Net Fixed Assets 125,000 80,000 365.000 279,000 -65,000 784,000 125,000 STOCKHOLDERS' EQUITY 80,000 Common stock - par value 365,000 Common stock - additional paid-in capital 258,000 Accumulated retained earnings -36,250 Total stockholders' equity 791,750 TOTAL LIABILITIES & STOCKHOLDERS' EQUITY 10,000 250,000 84,770 344,770 10,000 250,000 63,050 323,050 $1,033,170 $1,037,950 Intangible assets Trademark Goodwill Total Intangible Assets Other assets TOTAL ASSETS 58,000 100,000 158,000 12,500 $1,033,170 58,000 100,000 158,000 12.500 $1,037,950 $700.000 50,000 650,000 415,000 235,000 8,300 3,500 Income Statement For the Year January 1 through December 31, 2019 Gross Revenues Less: allowances for doubtful accounts Net Revenues Cost of goods sold Gross Profit Operating expenses Selling expenses Advertising expense Promotional expenses Administrative expenses Office supplies Office communication expense Total Operating Expenses Earnings Before Interests. Taxes. Depreciation and Amortizatior Depreciation Expenses Earnings Before Interests and Taxes Non-operating Revenues and Expenses Interest revenues Interest expenses Total Non-operating Income Earnings Before Tax Provisions for taxes Net Income 7,050 6,000 24,850 210.150 28.750 181,400 1,800 147,000 -145,200 36,200 14.480 $21,720 1 Financial Ratios 2 3 Liquidity Ratios 4 Current ratio = Current assets / Current liabilities 5 Quick ratio = (Current assets - inventory - prepaid expenses) / Current liabilities 6 Cash ratio = (Cash + short-term investments) / Current liabilities 7 8 Financial Leverage Ratios 9 Total debt ratio = Total liabilities / Total assets 10 Debt-to-equity ratio = Total debt / Total equity 11 Equity multiplier = Total assets / Total equity 12 Times interest earned ratio = Earnings before interests and taxes / Interest expenses 13 Cash coverage ratio = Earnings before interests, taxes, depreciation and amortization / Interest expenses 14 15 Turnover Ratios 16 Inventory turnover = Cost of goods sold / Average inventory 17 Days sales in inventory = 365 days / Inventory turnover 18 Receivables turnover = Net revenues / Average accounts receivables 19 Average collection period = 365 days / Receivables turnover 20 Payables turnover = Purchases / Average accounts payable 21 Note: Purchases = COGS + Ending inventory - Beginning inventory 22 Average payable period = 365 days / Payables turnover 23 Total asset turnover = Net revenues / Average total assets 24 25 Profitability Ratios 26 Gross margin = Gross profits / Net revenues 27 Profit margin = Net income / Net revenues 28 Return on Assets (ROA) = Net income / Average total assets 29 Return on Equity (ROE) = Net income / Average equityStep by Step Solution
There are 3 Steps involved in it
Step: 1

Get Instant Access to Expert-Tailored Solutions
See step-by-step solutions with expert insights and AI powered tools for academic success
Step: 2

Step: 3
Ace Your Homework with AI
Get the answers you need in no time with our AI-driven, step-by-step assistance
Get Started
The Social Media Handbook For Financial Advisors
Authors: Matthew Halloran
1st Edition
1118208013, 978-1118208014