

Question
***Fill in the blank options are bolded and italicized*** Assume that you are an existing bondholder of Target Corporation (TGT), a retailer of everyday essentials
***Fill in the blank options are bolded and italicized***
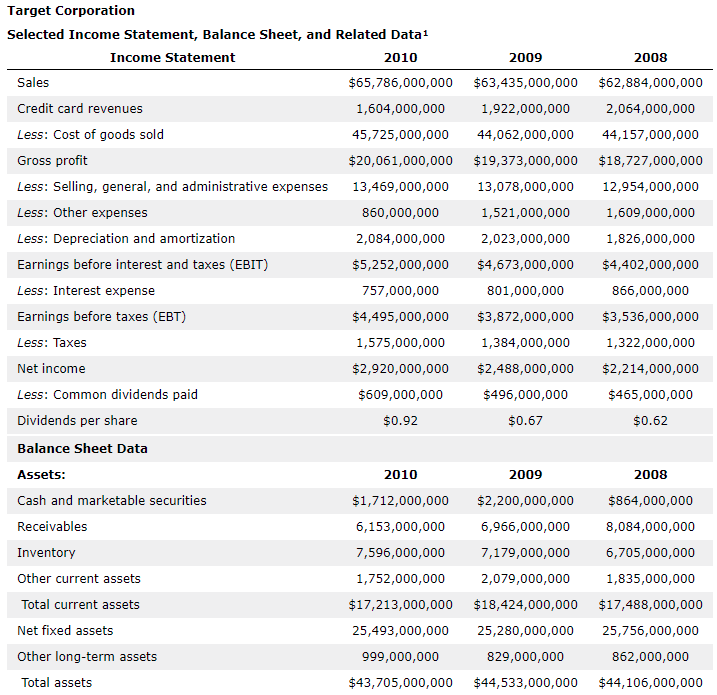
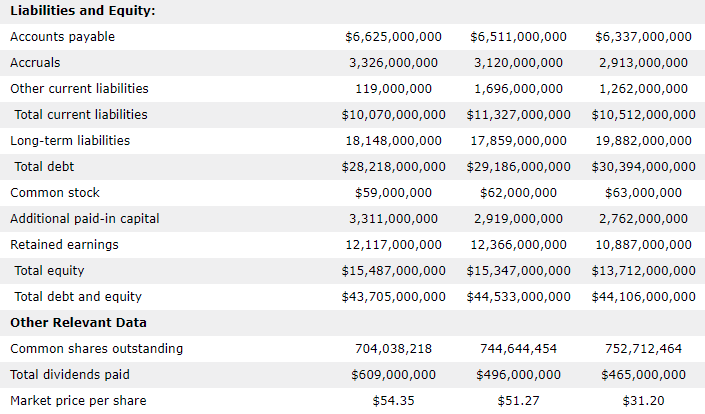
Assume that you are an existing bondholder of Target Corporation (TGT), a retailer of everyday essentials and fashionable, differentiated merchandise at discounted prices,and are interested in the companys historical and current financial activities and performance. Use the following financial data for Targetto complete and conduct your financial ratio analysis. Then answer the questions that follow. Remember, the results of a ratio analysis often identify issues requiring additional investigation.
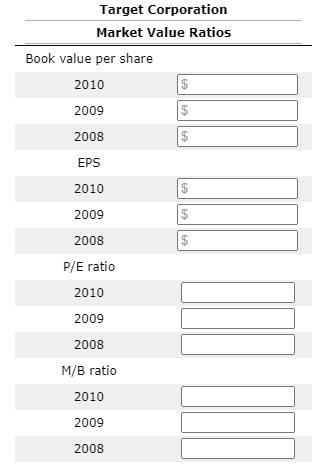
Now consider Targets market value ratios. That is, how do buyers and sellers of the companys shares perceive the value of the firmgiven its financial condition and operating performance? (Note: Round intermediate calculations to two decimal places.)
1. From 2008 through 2010, Targets market capitalization increased. Specifically, it increased from $23,484,628,877 to $38,177,921,157 between 2008 and 2009 and to $38,264,477,148 in 2010. Which of the following statements are correct? Check all that apply.
During the periods 2008 to 2009 and 2009 to 2010, the number of common shares outstanding decreased by 1.07% and 5.45%, respectively.
During the periods 2008 to 2009 and 2009 to 2010, the market price of Targets common shares increased by 64.33% and 6.01%, respectively.
During the periods 2008 to 2009 and 2009 to 2010, the positive pressure from the increasing market prices was greater, or stronger, than the offsetting, or negative, pressure from the decreased number of shares outstanding.
During the periods 2008 to 2009 and 2009 to 2010, the market price of Targets common shares increased by 39.15% and 5.67%, respectively.
These changes in the companys market capitalization should be construed as __(indeterminate / bad)__ news and should be investigated further. One reasonable question that should be asked is: For what reason were the __(40,606,236 / 8,068,010 / 48,674,246)__ shares, or approximately 6.47% of 2008s outstanding shares, repurchased during the period 2008 through 2010? Was it part of earlier planned program, or were they repurchased to reduce the supply of shares available in the equity market and thereby __(decrease / increase)__ the market price of the shares? (Note: The answer to this question can be found, in part, by reading the companys annual reports.)
2. Similarly, from 2008 through 2010, the companys book value __(decrease / increased)__ from year to year. In general, and assuming that everything else remains constant, this behavior should have tended to __(decrease / increase)__ the companys market-to-book (M/B) ratio. However, over time, Targets M/B ratio had increased, which suggests that the percentage increase in the market price had been __(less / greater)__ than the percentage increase in the companys book value.
Because the denominator of both the market price per share and the book value per share ratios is the number of __(common / common and preferred / preferred)__ shares outstanding, the trend of the M/B ratio indicates which of the following?
The market placed an increasing value on the portion of the company owned by the creditors and debtholders.
The market placed an increasing value on the portion of the company owned by the common shareholders.
The market placed a decreasing value on the portion of the company owned by the common shareholders.
3. Targets earnings per share (EPS) ratio, which is calculated by dividing its __(net income / total assets)__ by the number of common shares outstanding, exhibited a consistently increasing trend, growing by __(32.32% / 24.25% / 44.67%)__ between 2008 and 2009 and by __(50.91% / 38.79% / 49.70%)__ between 2009 and 2010.
4. From 2008 through 2010, Targets price-to-earnings (P/E) ratio exhibited an inconsistent trend. Which of the following phenomena contributed to this pattern? Check all that apply.
Between 2008 and 2009, the market price per share of Targets common stock increased by a greater percentage than that exhibited by its EPS.
Between 2009 and 2010, Targets EPS increased by a greater percentage than the market price of its common shares.
Between 2009 and 2010, the market price per share of Targets common stock increased by a greater percentage than that exhibited by its EPS.
Target Corporation Selected Income Statement, Balance Sheet, and Related Data1 Income Statement 2010 2009 2008 Sales $65,786,000,000 $63,435,000,000 $62,884,000,000 Credit card revenues 1,604,000,000 1,922,000,000 2,064,000,000 Less: Cost of goods sold 45,725,000,000 44,062,000,000 44,157,000,000 Gross profit $20,061,000,000 $19,373,000,000 $18,727,000,000 Less: Selling, general, and administrative expenses 13,469,000,000 13,078,000,000 12,954,000,000 Less: Other expenses 860,000,000 1,521,000,000 1,609,000,000 Less: Depreciation and amortization 2,084,000,000 2,023,000,000 1,826,000,000 Earnings before interest and taxes (EBIT) $5,252,000,000 $4,673,000,000 $4,402,000,000 Less: Interest expense 757,000,000 801,000,000 866,000,000 Earnings before taxes (EBT) $4,495,000,000 $3,872,000,000 $3,536,000,000 Less: Taxes 1,575,000,000 1,384,000,000 1,322,000,000 Net income $2,920,000,000 $2,488,000,000 $2,214,000,000 Less: Common dividends paid $609,000,000 $496,000,000 $465,000,000 Dividends per share $0.92 $0.67 $0.62 Balance Sheet Data Assets: 2010 2009 2008 Cash and marketable securities $1,712,000,000 $2,200,000,000 $864,000,000 Receivables 6,153,000,000 6,966,000,000 8,084,000,000 Inventory 7,596,000,000 7,179,000,000 6,705,000,000 Other current assets 1,752,000,000 2,079,000,000 1,835,000,000 Total current assets $17,213,000,000 $18,424,000,000 $17,488,000,000 Net fixed assets 25,493,000,000 25,280,000,000 25,756,000,000 Other long-term assets 999,000,000 829,000,000 862,000,000 Total assets $43,705,000,000 $44,533,000,000 $44,106,000,000 Liabilities and Equity: Accounts payable Accruals Other current liabilities Total current liabilities Long-term liabilities Total debt Common stock Additional paid-in capital Retained earnings Total equity Total debt and equity Other Relevant Data Common shares outstanding Total dividends paid Market price per share $6,625,000,000 $6,511,000,000 $6,337,000,000 3,326,000,000 3,120,000,000 2,913,000,000 119,000,000 1,696,000,000 1,262,000,000 $10,070,000,000 $11,327,000,000 $10,512,000,000 18,148,000,000 17,859,000,000 19,882,000,000 $28,218,000,000 $29,186,000,000 $30,394,000,000 $59,000,000 $62,000,000 $63,000,000 3,311,000,000 2,919,000,000 2,762,000,000 12,117,000,000 12,366,000,000 10,887,000,000 $15,487,000,000 $15,347,000,000 $13,712,000,000 $43,705,000,000 $44,533,000,000 $44,106,000,000 744,644,454 704,038,218 $609,000,000 $496,000,000 752,712,464 $465,000,000 $31.20 $54.35 $51.27 Target Corporation Market Value Ratios Book value per share 2010 $ $ 2009 $ 2008 $ EPS 2010 $ 2009 $ $ 2008 P/E ratio 2010 2009 2008 M/B ratio 2010 2009 2008Step by Step Solution
There are 3 Steps involved in it
Step: 1

Get Instant Access to Expert-Tailored Solutions
See step-by-step solutions with expert insights and AI powered tools for academic success
Step: 2

Step: 3
Ace Your Homework with AI
Get the answers you need in no time with our AI-driven, step-by-step assistance
Get Started
Financial Markets and Institutions
Authors: Jeff Madura
11th Edition
1133947875, 9781305143005, 1305143000, 978-1133947875