

Answered step by step
Verified Expert Solution
Question
1 Approved Answer
Please Show the Answer in EXCEL and The Specific Calculations. Thank you. Use Excel to evaluate the following capital budgeting project for the best, base,
Please Show the Answer in EXCEL and The Specific Calculations. Thank you.
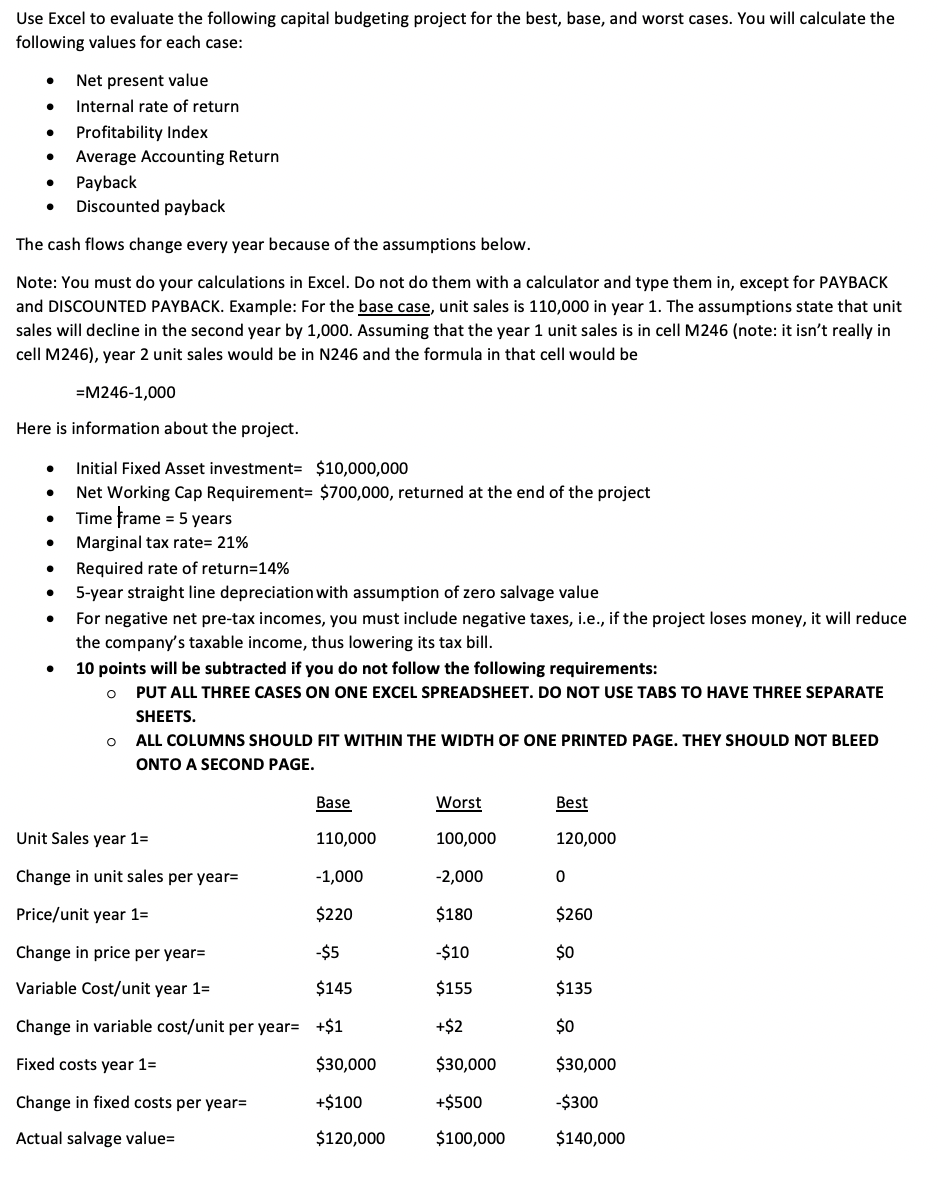
Use Excel to evaluate the following capital budgeting project for the best, base, and worst cases. You will calculate the following values for each case: Net present value Internal rate of return Profitability Index Average Accounting Return Payback Discounted payback . . . The cash flows change every year because of the assumptions below. Note: You must do your calculations in Excel. Do not do them with a calculator and type them in, except for PAYBACK and DISCOUNTED PAYBACK. Example: For the base case, unit sales is 110,000 in year 1. The assumptions state that unit sales will decline in the second year by 1,000. Assuming that the year 1 unit sales is in cell M246 (note: it isn't really in cell M246), year 2 unit sales would be in N246 and the formula in that cell would be =M246-1,000 Here is information about the project. . . . Initial Fixed Asset investment= $10,000,000 Net Working Cap Requirement= $700,000, returned at the end of the project Time frame = 5 years Marginal tax rate= 21% Required rate of return=14% 5-year straight line depreciation with assumption of zero salvage value For negative net pre-tax incomes, you must include negative taxes, i.e., if the project loses money, it will reduce the company's taxable income, thus lowering its tax bill. 10 points will be subtracted if you do not follow the following requirements: PUT ALL THREE CASES ON ONE EXCEL SPREADSHEET. DO NOT USE TABS TO HAVE THREE SEPARATE SHEETS. ALL COLUMNS SHOULD FIT WITHIN THE WIDTH OF ONE PRINTED PAGE. THEY SHOULD NOT BLEED ONTO A SECOND PAGE. . o o Base Worst Best Unit Sales year 1= 110,000 100,000 120,000 Change in unit sales per year= -1,000 -2,000 0 Price/unit year 1= $220 $180 $260 Change in price per year= -$5 -$10 $0 Variable Cost/unit year 1= $145 $155 $135 Change in variable cost/unit per year= +$1 +$2 $0 Fixed costs year 1= $30,000 $30,000 $30,000 Change in fixed costs per year= +$100 +$500 $300 Actual salvage value= $120,000 $100,000 $140,000 Use Excel to evaluate the following capital budgeting project for the best, base, and worst cases. You will calculate the following values for each case: Net present value Internal rate of return Profitability Index Average Accounting Return Payback Discounted payback . . . The cash flows change every year because of the assumptions below. Note: You must do your calculations in Excel. Do not do them with a calculator and type them in, except for PAYBACK and DISCOUNTED PAYBACK. Example: For the base case, unit sales is 110,000 in year 1. The assumptions state that unit sales will decline in the second year by 1,000. Assuming that the year 1 unit sales is in cell M246 (note: it isn't really in cell M246), year 2 unit sales would be in N246 and the formula in that cell would be =M246-1,000 Here is information about the project. . . . Initial Fixed Asset investment= $10,000,000 Net Working Cap Requirement= $700,000, returned at the end of the project Time frame = 5 years Marginal tax rate= 21% Required rate of return=14% 5-year straight line depreciation with assumption of zero salvage value For negative net pre-tax incomes, you must include negative taxes, i.e., if the project loses money, it will reduce the company's taxable income, thus lowering its tax bill. 10 points will be subtracted if you do not follow the following requirements: PUT ALL THREE CASES ON ONE EXCEL SPREADSHEET. DO NOT USE TABS TO HAVE THREE SEPARATE SHEETS. ALL COLUMNS SHOULD FIT WITHIN THE WIDTH OF ONE PRINTED PAGE. THEY SHOULD NOT BLEED ONTO A SECOND PAGE. . o o Base Worst Best Unit Sales year 1= 110,000 100,000 120,000 Change in unit sales per year= -1,000 -2,000 0 Price/unit year 1= $220 $180 $260 Change in price per year= -$5 -$10 $0 Variable Cost/unit year 1= $145 $155 $135 Change in variable cost/unit per year= +$1 +$2 $0 Fixed costs year 1= $30,000 $30,000 $30,000 Change in fixed costs per year= +$100 +$500 $300 Actual salvage value= $120,000 $100,000 $140,000Step by Step Solution
There are 3 Steps involved in it
Step: 1

Get Instant Access to Expert-Tailored Solutions
See step-by-step solutions with expert insights and AI powered tools for academic success
Step: 2

Step: 3
Ace Your Homework with AI
Get the answers you need in no time with our AI-driven, step-by-step assistance
Get Started
Financial Markets and Institutions
Authors: Jeff Madura
11th Edition
1133947875, 9781305143005, 1305143000, 978-1133947875