Answered step by step
Verified Expert Solution
Question
1 Approved Answer
Fill in the following with the information provided above Cash Flow Statement Projected 2018 2019 2020 2021 Cash Flow from Operating Activities Net Income Plus
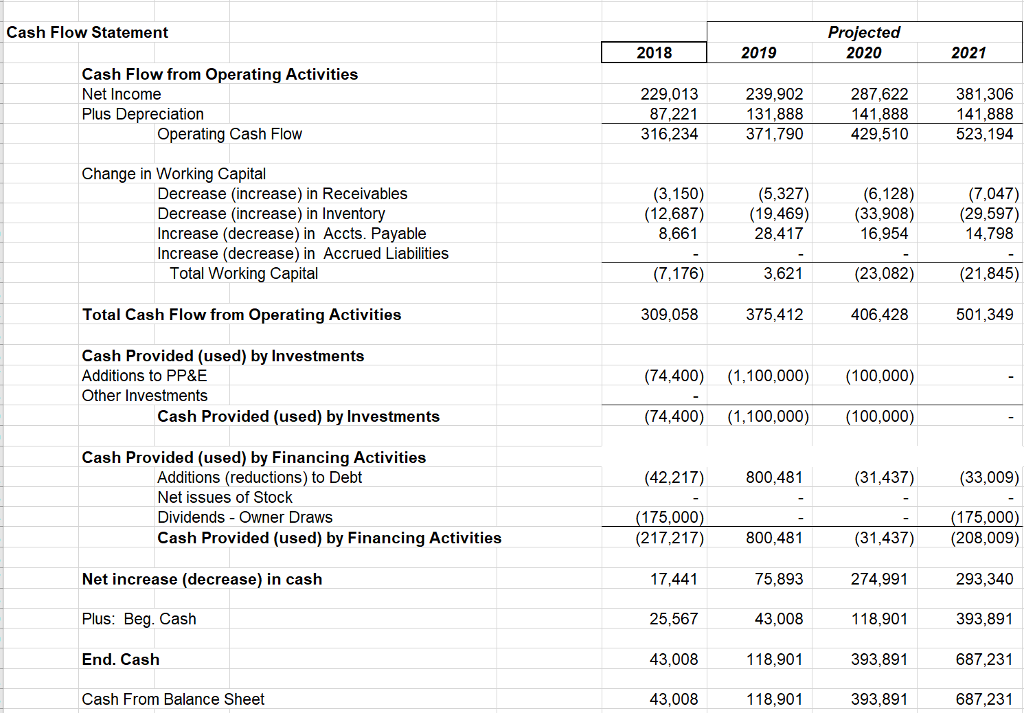
Fill in the following with the information provided above
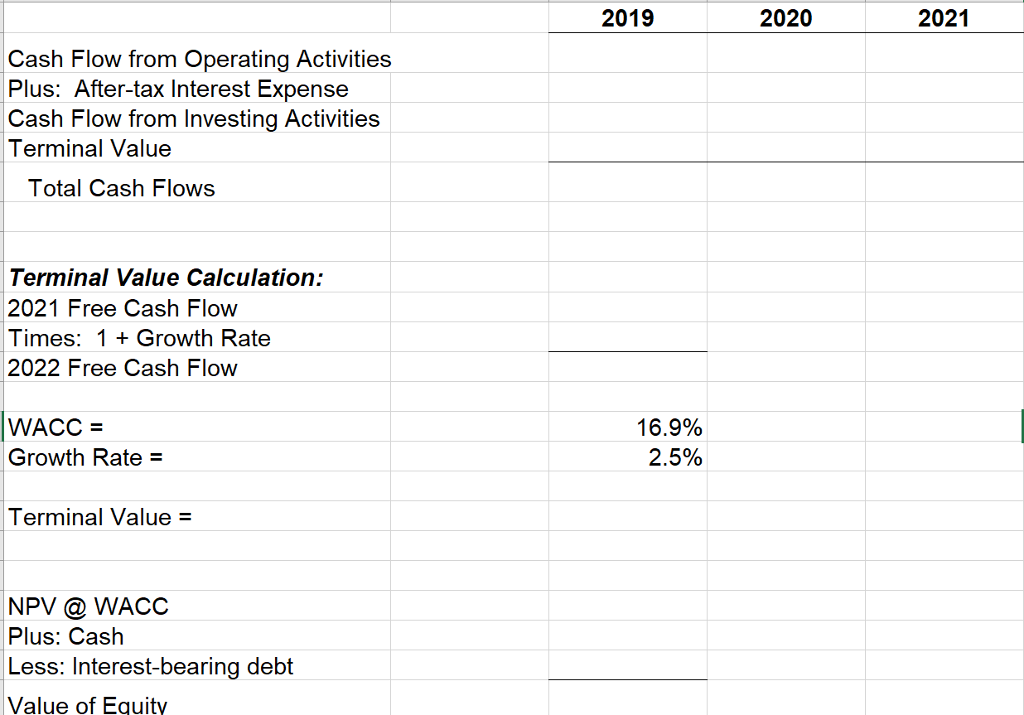
Cash Flow Statement Projected 2018 2019 2020 2021 Cash Flow from Operating Activities Net Income Plus Depreciation 239,902 131,888 371,790 381,306 141,888 523,194 229,013 87,221 316,234 287,622 141,888 429,510 Operating Cash Flow Change in Working Capital Decrease (increase) in Receivables Decrease (increase) in Inventory Increase (decrease) in Accts. Payable Increase (decrease) in Accrued Liabilities (5,327) 28,417 3,621 375,412 (6,128) 16,954 (23,082) 406,428 (7,047) (3,150) 8,661 7,176) (12,687) (19,469) (33,908) (29,597) 14,798 (21,845) 501,349 Total Working Capital Total Cash Flow from Operating Activities 309,058 Cash Provided (used) by Investments Additions to PP&E Other Investments (74,400) (1,100,000 100,000) Cash Provided (used) by Investments (74,400) (1,100,000) (100,000) Cash Provided (used) by Financing Activities (42,217) 800,481 (31,437) (33,009) Additions (reductions) to Debt Net issues of Stock Dividends - Owner Draws(175,000)(175,000) Cash Provided (used) by Financing Activities Net increase (decrease) in cash Plus: Beg. Cash End. Cash Cash From Balance Sheet (217,217) 800,481 75,893 43,008 118,901 118,901 17,441 25,567 43,008 43,008 (31,437)(208,009) 274,991 118,901 393,891 393,891 293,340 393,891 687,231 687,231Step by Step Solution
There are 3 Steps involved in it
Step: 1
Get Instant Access to Expert-Tailored Solutions
See step-by-step solutions with expert insights and AI powered tools for academic success
Step: 2
Step: 3
Ace Your Homework with AI
Get the answers you need in no time with our AI-driven, step-by-step assistance
Get Started